Oil prices were seen trading higher reaching a two-year high as political developments in Saudi Arabia saw a wave of arrests of high ranking officials. WTI Crude oil prices rose to settle at $57.35 a barrel while Brent oil futures rose to $64.27. The gains in oil prices came as the OPEC general body meeting is due to be held in a few weeks time.
On the economic front, the RBA's monetary policy meeting earlier today saw no changes to interest rates. The RBA gave an optimistic view of the economy as it held interest rates unchanged at 1.5%. It forecasted that inflation would rise over time and expects GDP to improve as well.
Looking ahead, the economic data today includes speeches from ECB President Mario Draghi followed by Fed Chair Janet Yellen later in the afternoon. The BoC Governor Poloz is also expected to speak today. The German industrial production and the Eurozone retail sales figures will be released.
EURUSD Intraday Analysis

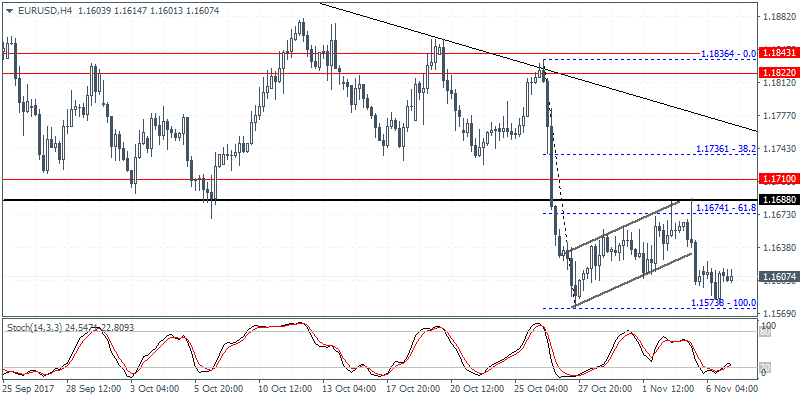
EURUSD (1.1607):Price action in EURUSD was muted as the overall price trend turns flat. EURUSD has been moving sideways for nearly seven consecutive days following the declines below the 1.1700 support level. On the 4-hour chart, following the breakout from the bearish flag pattern, EURUSD was seen turning bullish with a bullish engulfing pattern on the 4-hour chart. This could suggest some near term upside. However, with price supported above the 1.1573 handle, there is a strong potential for the bearish flag pattern to be invalidated. Still, EURUSD is expected to maintain its range within 1.1688 and 1.1573 levels of resistance and support.
USDJPY Intraday Analysis

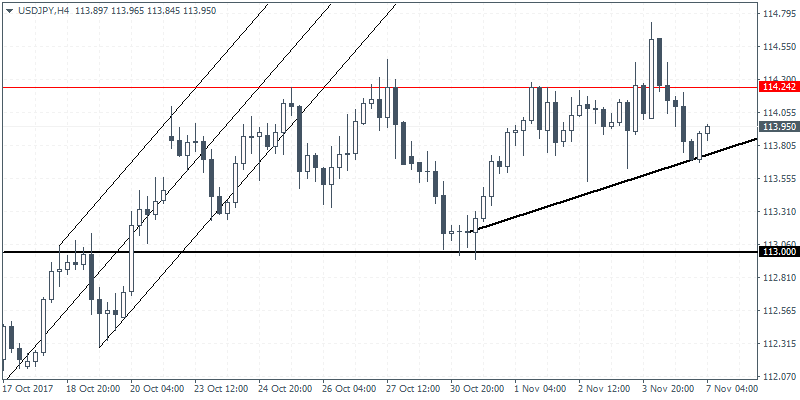
USDJPY (113.95):The USDJPY attempted to open on a bullish note yesterday. The yen weakened after comments from BoJ's Governor Kuroda. Kuroda said that the central bank's monetary policy was still needed for some time reiterating the central bank's commitment to fight deflation. Despite the brief rally in the dollar, USDJPY settled to close weaker on the day. Price action still consolidates below the resistance level which increases the risk of a downside correction. The evolving inverse head and shoulders pattern along with the ascending triangle pattern put the bias to the upside. However, USDJPY will need to clear the 114.00 price handle to post further gains.
EURGBP Intraday Analysis

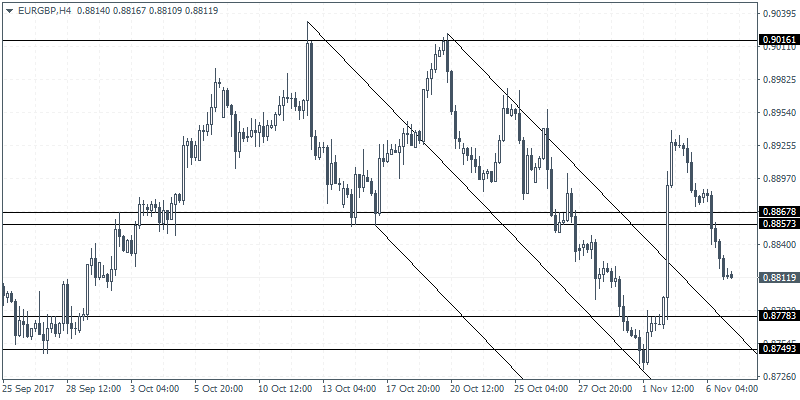
EURGBP (0.8811):The EURGBP extended the declines yesterday as price breached past the support level at 0.8867 - 0.8857 level. This indicates continued decline with the next support at 0.8778 likely to be tested. Any short-term bounces are expected to be contained near the 0.8867 - 0.8857 level which could now act as resistance. However, a higher low being formed near the support of 0.8778 could suggest another move to the upside, provided the resistance level can be breached.
