Get 40% Off
These stocks are up over 10% post earnings. Did you spot the buying opportunity? Our AI did.Read how

Oil Near Stopping Point

Published 03/10/2016, 11:58 PM
Updated 07/09/2023, 06:31 AM

Three weeks ago, the seasonal switch in the crude complex took place. And it’s been rally on ever since. But now, that rally is losing steam. Here’s the technical picture for why:
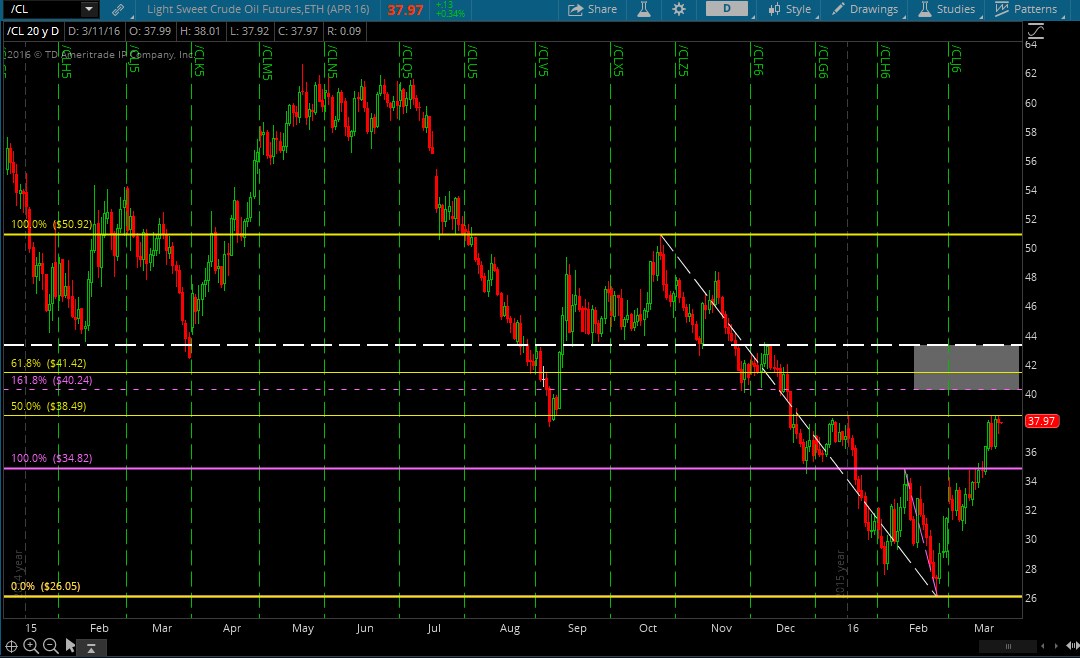
Oil Yearly Chart

On the continuous chart, the 38.49 level marked /cl’s 50% retracement from its prior swing high on the daily and weekly charts up at 50.92 (you do remember when oil was priced in the 50s, correct?). This level also coincides with a few key prior structure areas on the daily chart (August 24, 2015 low, Dec. 24, 2015 high, Jan. 4, 2016 high).

Above the 50% retracement, we find a VERY interesting zone of confluence between $40.24 and 43.25. Here’s why:

1. That zone begins with a 1.618% fibonacci inversion from the low of the year (26.05), to its prior swing high (34.82).

2. The zone includes a 61.8% retracement of the prior swing down impulse leg 50.92-26.05.

3. The top of that zone (43.25) touches multiple prior structure levels going back more than one year

So should the 50% retrace fail, or if we see a small pullback and bounce, I’d be watching that 40.24-43.25 zone for bears to come back in and roar loudly.

Latest comments

Good points. I think we are headed back into the $20's this and next week. Then perhaps we could go back up to $40-50, but not before a trip back to the $20's.
yeah, so 50% up in 3 weeks and now more than 30% down again?? You must be kidding
A volatile oil price is what I like to trade better than straight up or down. So some pull back is not a bad thing.
Risk Disclosure: Trading in financial instruments and/or cryptocurrencies involves high risks including the risk of losing some, or all, of your investment amount, and may not be suitable for all investors. Prices of cryptocurrencies are extremely volatile and may be affected by external factors such as financial, regulatory or political events. Trading on margin increases the financial risks.
Before deciding to trade in financial instrument or cryptocurrencies you should be fully informed of the risks and costs associated with trading the financial markets, carefully consider your investment objectives, level of experience, and risk appetite, and seek professional advice where needed.
Fusion Media would like to remind you that the data contained in this website is not necessarily real-time nor accurate. The data and prices on the website are not necessarily provided by any market or exchange, but may be provided by market makers, and so prices may not be accurate and may differ from the actual price at any given market, meaning prices are indicative and not appropriate for trading purposes. Fusion Media and any provider of the data contained in this website will not accept liability for any loss or damage as a result of your trading, or your reliance on the information contained within this website.
It is prohibited to use, store, reproduce, display, modify, transmit or distribute the data contained in this website without the explicit prior written permission of Fusion Media and/or the data provider. All intellectual property rights are reserved by the providers and/or the exchange providing the data contained in this website.
Fusion Media may be compensated by the advertisers that appear on the website, based on your interaction with the advertisements or advertisers.
© 2007-2024 - Fusion Media Limited. All Rights Reserved.