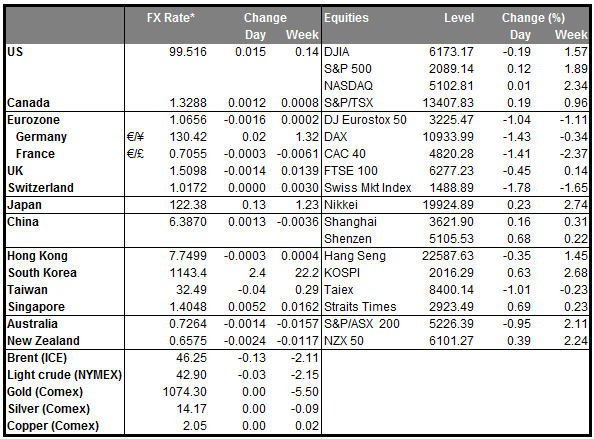
• Oil extends declines on Iran sanctions fallout The UN nuclear agency declared on Saturday that Iran had fulfilled the conditions of its nuclear agreement. As such, Western sanctions on the country’s oil exports have now officially been lifted. Iran holds approximately 10% of confirmed global oil reserves. The deputy oil minister stated on Sunday that crude oil exports are ready to increase by half a million barrels per day, with plans to add another half a million over a few months. Some market participants even expect Iran to offer its oil at lower than market prices in order to gain back market share, at least initially. The global oil glut along with the weak demand coming from China’s and Eurozone’s slowdown, drive oil prices lower. As the market seems to be dominated by net shorts, we could see further near-term slides as investors may be hesitant to make an attempt to catch the falling knife. Thus, oil related currencies such as CAD and NOK could remain under selling pressure.
• Today’s highlights: During the European day, the Riksbank will release the minutes of its January 4th extraordinary policy meeting. At this meeting, the Bank’s Executive Board decided to give the Governor additional powers to be able to instantly intervene in the currency market in order to safeguard the rise in inflation from a possible appreciation of the krona. The Bank also signaled that it is still highly prepared to act by reducing the repo rate, extending the securities purchases or by lending money to companies via banks, in addition to FX market intervention. The Bank’s Deputy Governor, stated opposition to the decision as he does not consider currency intervention a suitable tool to make monetary policy more expansionary. Thus, the minutes of the meeting will give us additional insight as to the Deputy Governor’s skepticism and perhaps under what circumstances the Bank may intervene, as it stated that there is no target for the exchange rate.
• In the US, markets will remain closed in celebration of Martin Luther King Jr. day.
• As for the rest of the week, on Tuesday during the Asian day, China’s GDP growth for Q4 is expected to have slowed to +6.8% yoy from +6.9% yoy. While this is above the government’s new 6.5% growth target, recent soft manufacturing and trade data suggest that the economy is still slowing down. China also releases its industrial production, fixed asset investment and retail sales for December. The main focus could be on GDP growth, which could weaken AUD and NZD, at least at the release. During the European day, the main event will be the UK CPI rate for December. The headline figure is forecast to have accelerated somewhat, while the core rate is expected to have remained unchanged from the previous month. In the minutes of the latest BoE meeting, the MPC noted that the increase in inflation will be more gradual than previously expected, as a result of the renewed plunge in oil prices. As such, a slight acceleration in the inflation rate is in line with the BoE’s view of a ‘gradual’ increase in inflation and could relieve some selling pressure from GBP at the release. From Germany, the ZEW survey for January is coming out. Both the current situation index and the expectations index are expected to decline, which could put the common currency under renewed selling pressure.
• On Wednesday, the highlight will be the Bank of Canada monetary policy meeting. At their last meeting, Bank officials decided to keep the benchmark rate unchanged, but in their statement they noted that cuts in resource-sector spending continued to weigh on business investment. Furthermore, they noted that there have been significant job losses in energy-producing regions. Bearing in mind that oil prices have continued trading lower since the last meeting, and that Governor Poloz recently left the door open for further rate cuts, we expect the Bank to lower rates to support the softening economy in the foreseeable future, if not at this meeting. The implied market probability of a 25bps rate cut at this meeting currently lies close to 50%. We also expect the Bank to maintain a dovish stance, repeating that the economy’s adjustment to the decline in the terms of trade is being aided by a weaker CAD and monetary easing. This could increase selling interest on the Loonie. The UK employment report for November is forecast to show slowing wage growth, which could weaken GBP. The US CPI rate for December is expected to have accelerated.
• On Thursday, all eyes will be on the ECB policy meeting. In the previous meeting, the Governing Council reduced the deposit facility rate by 10bps and extended the QE program for at least 6 more months. In the meantime, the Bank expanded the assets it can purchase and decided to reinvest the proceeds from the bonds that mature. Some unnamed members of the Governing Council stated on Thursday that they are skeptical about further policy action in the near-term and that they need to monitor the effectiveness of the previous actions first. As a result, we don’t expect any change in policy at this meeting. Instead, we expect the Bank to remain on hold in order to assess whether the failure of the CPI to accelerate in December was a one-off or whether the previous measures are not exerting the desired effects.
• On Friday, from Europe, we get the preliminary manufacturing and service-sector PMI data for January from several European countries and the Eurozone as a whole. All the indices are forecast to decline or remain unchanged, which could weaken the common currency, at least temporarily. From Canada, the CPI data for December are forecast to show that both the headline and core rates have risen from the previous month and are now very close to the BoC target. In the UK, retail sales for December are expected to have fallen, which could weaken GBP at the release.
The Market
EUR/USD hits resistance at 1.0980
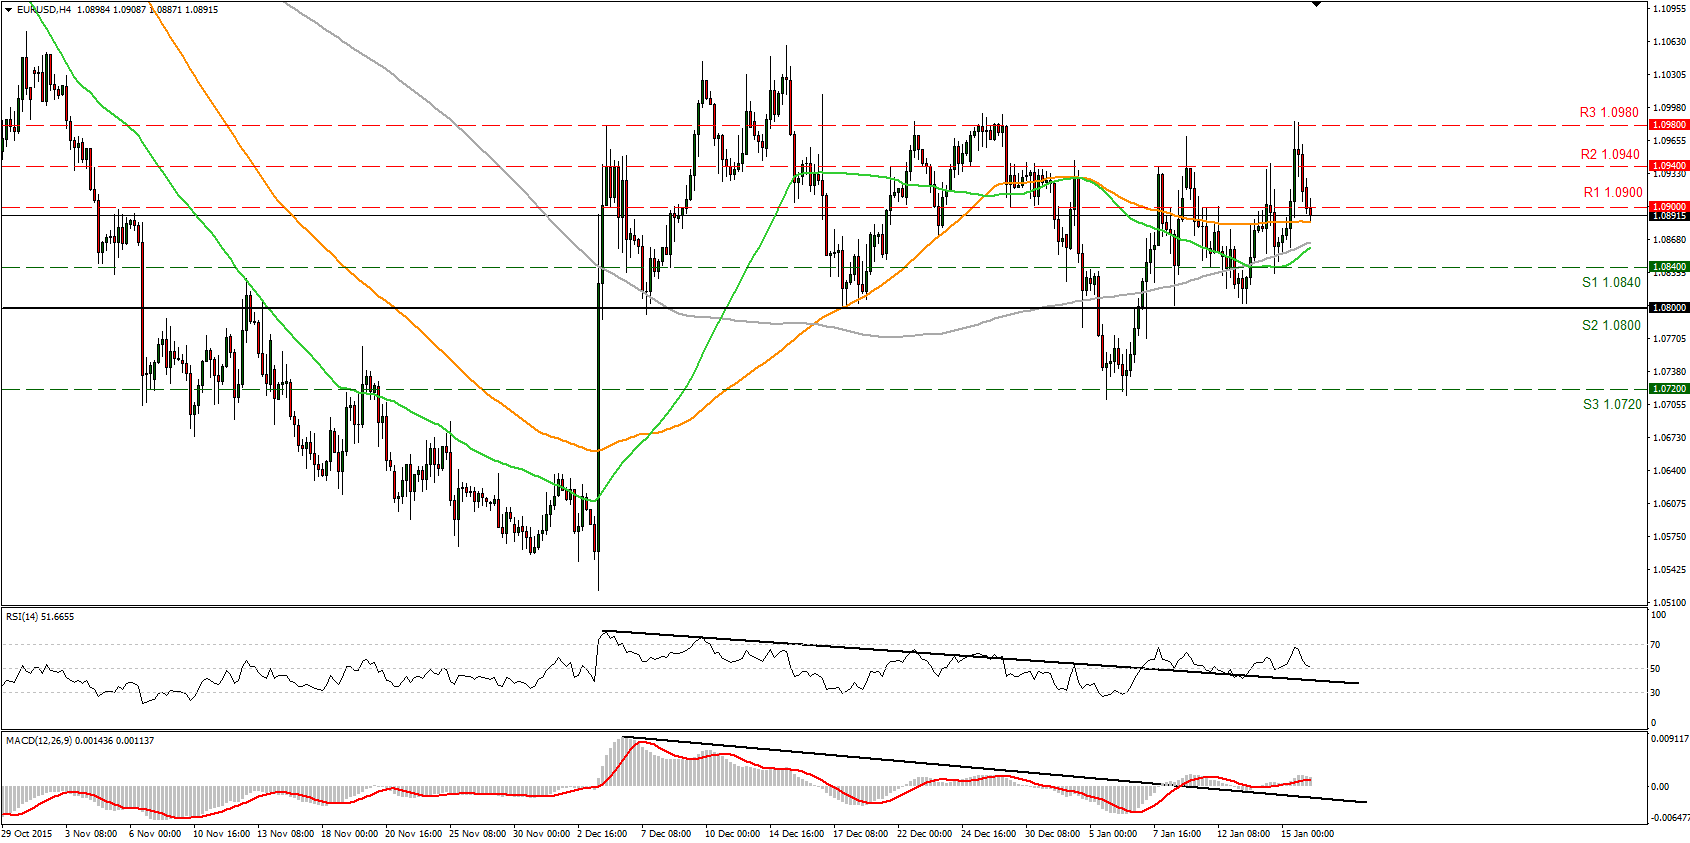
• EUR/USD traded lower on Friday after hitting resistance at 1.0980 (R3). Subsequently, the pair fell below the 1.0900 (R1) support-turned-into-resistance area and now the rate looks to be headed towards the 1.0840 (S1) line. A clear break below that hurdle is likely to aim for another test at the key 1.0800 (S2) territory. Given that the pair has been oscillating between the 1.0980 (R3) zone and the key support obstacle of 1.0800 (S2), I prefer to remain on the sidelines for now with regards to the short-term outlook. I would like to see another dip below 1.0800 (S2) before trusting further declines. Switching to the daily chart, I see that the 1.0800 (S2) key hurdle is the lower bound of the range the pair had been trading from the last days of April until the 6th of November. I also see that on the 7th and 17th of December, and on the 8th of January, the rate rebounded from that zone. Therefore, the fact that EUR/USD is trading above that key zone makes me stay flat as far as the medium-term picture is concerned as well.
• Support: 1.0840 (S1), 1.0800 (S2), 1.0720 (S3)
• Resistance: 1.0900 (R1), 1.0940 (R2), 1.0980 (R3)
GBP/USD could continue lower
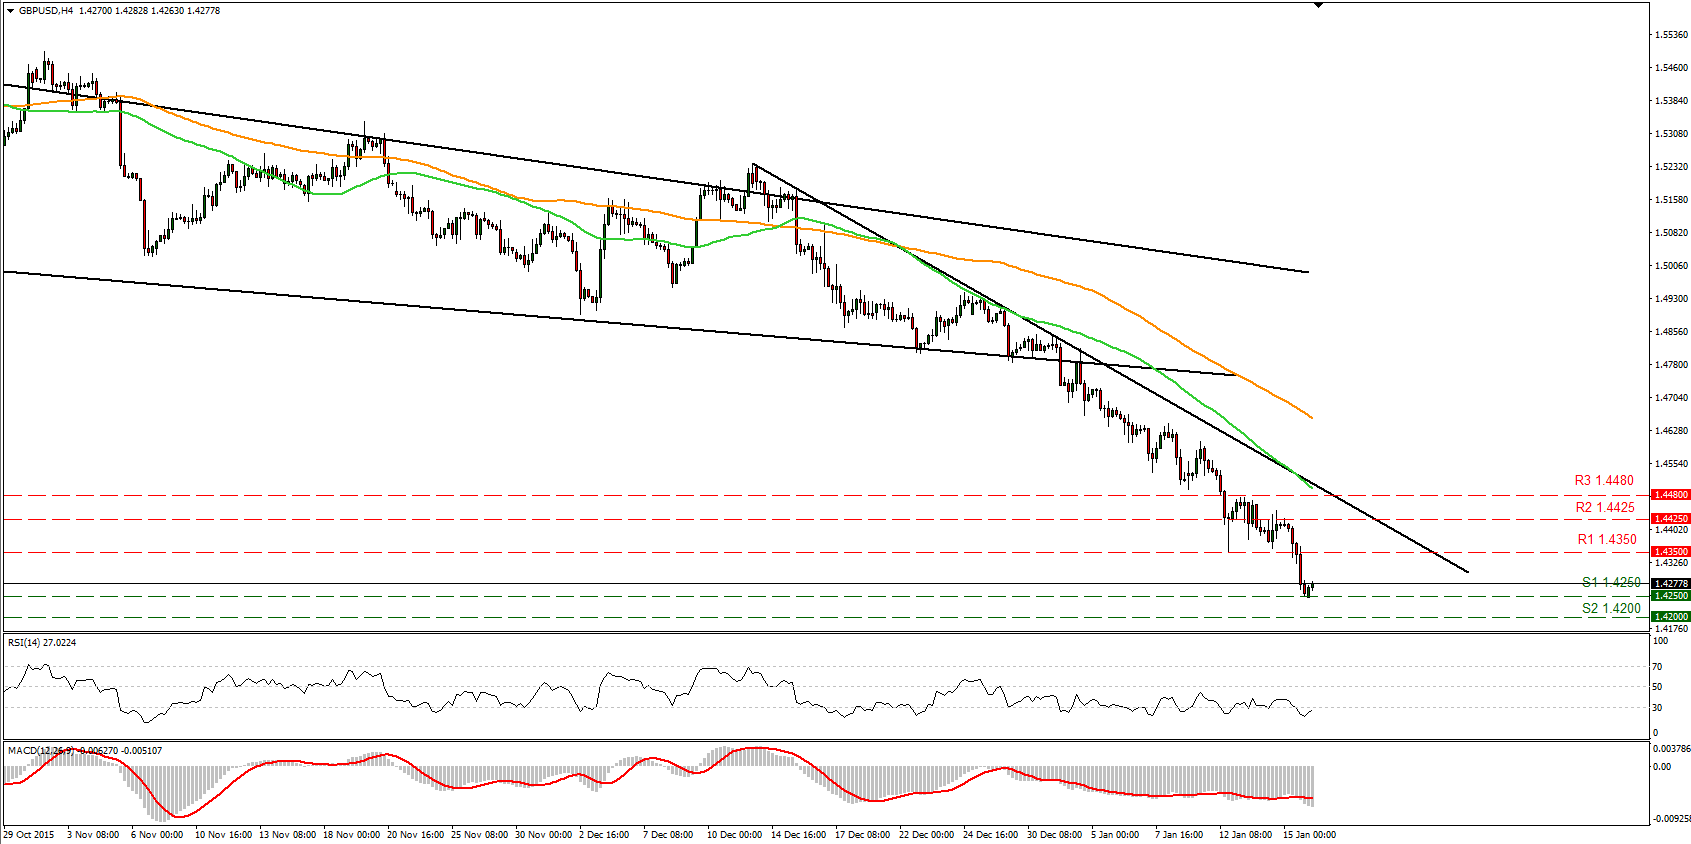
• GBP/USD tumbled on Friday, fell below 1.4350 (R1) support-turned-into-resistance area and found some buy orders at the 1.4250 (S1) zone defined by the low of the 25th of May 2010. A break below that territory could trigger larger bearish extensions and perhaps challenge our next support at 1.4200 (S2). The short-term picture remains negative and I would treat any possible extensions or rebounds, as corrective moves. Our short-term momentum studies detect slowing downside speed and increase the likelihood for a minor correction before the next leg lower. The RSI rebounded from its below 30 line, while the MACD, although negative, shows signs of bottoming and could move north. As for the broader trend, the price structure remains lower peaks and lower troughs below the 80-day exponential moving average, which is pointing down. Thus, I still see a negative longer-term picture as well.
• Support: 1.4250 (S1), 1.4200 (S2), 1.4165 (S3)
• Resistance: 1.4350 (R1), 1.4425 (R2), 1.4480 (R3)
USD/JPY slides after breaking 117.30
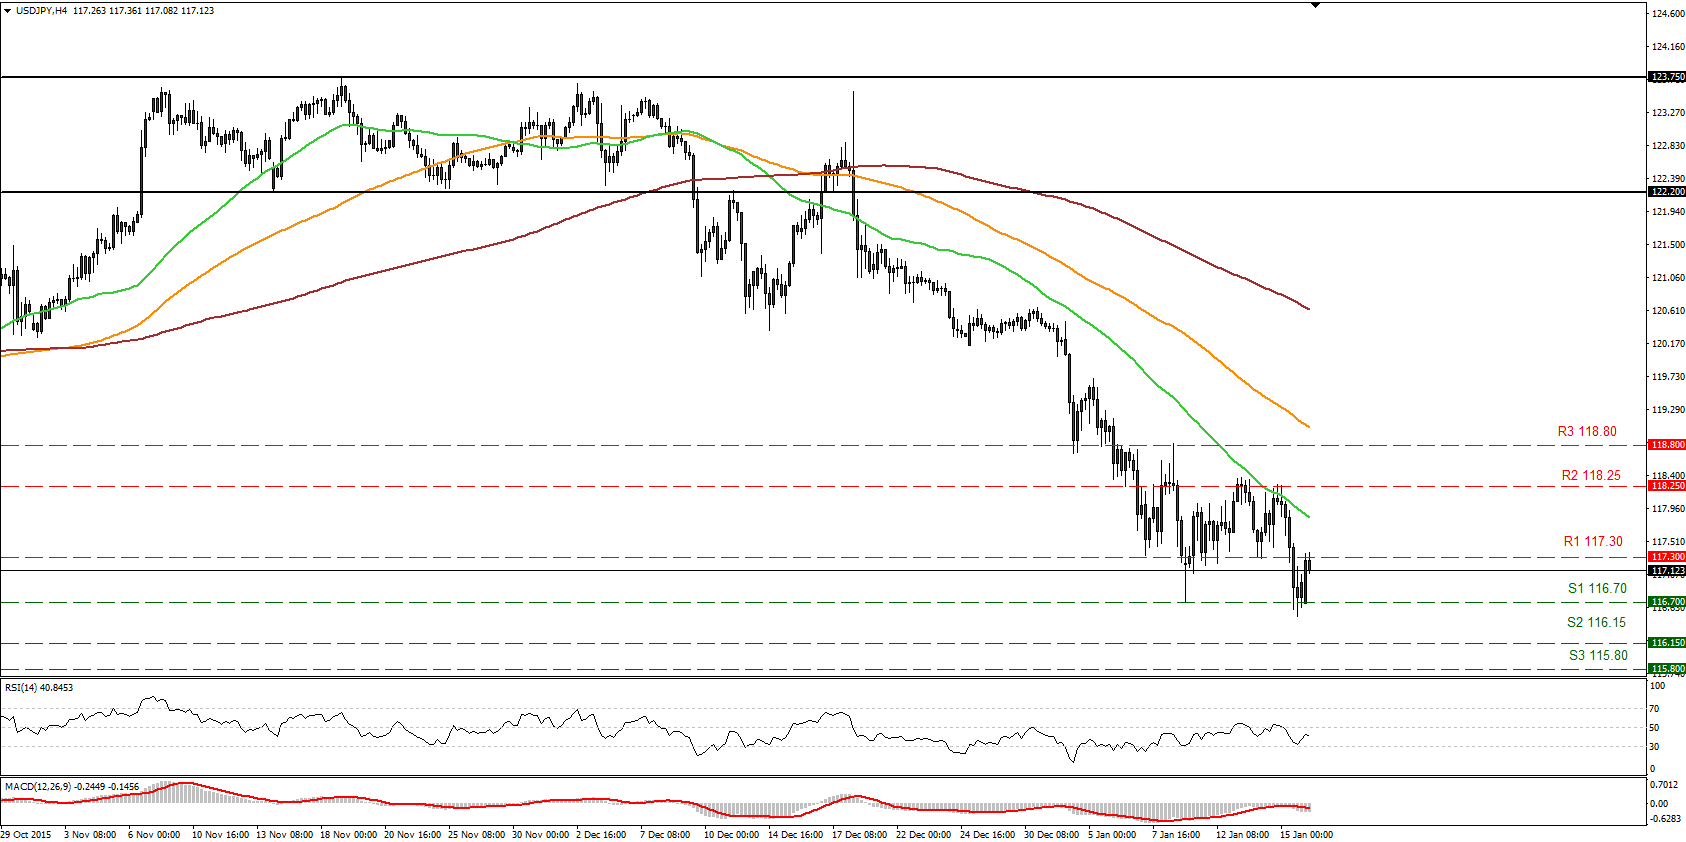
• USD/JPY plunged on Friday after breaking below the 117.30 (R1) support (now turned into resistance) zone. The decline halted around the 116.70 (S1) support area, defined by the low of the 11th of January. The pair then bounced up to test the 117.30 (R1) area as a resistance this time. As long as the rate remains below that obstacle, I see the likelihood for another strong bearish leg. I believe that the bears are likely to aim for another test at 116.70 (S1), where a decisive dip is likely to open the way for the 116.15 (S2) zone defined by the low of the 24th of August. Our short-term oscillators, however, point to a correction before the next leg lower. The RSI hit resistance at its 30 line and turned up, while the MACD, although negative, shows signs of bottoming and could cross above its trigger line soon. I also see positive divergence between our momentums and the price action. In the bigger picture, I still believe that the break below the key zone of 118.25 raises some concerns for a longer-term trend reversal.
• Support: 116.70 (S1), 116.15 (S2), 115.80 (S3)
• Resistance: 117.30 (R1), 118.25 (R2), 118.80 (R3)
WTI falls below 30.00
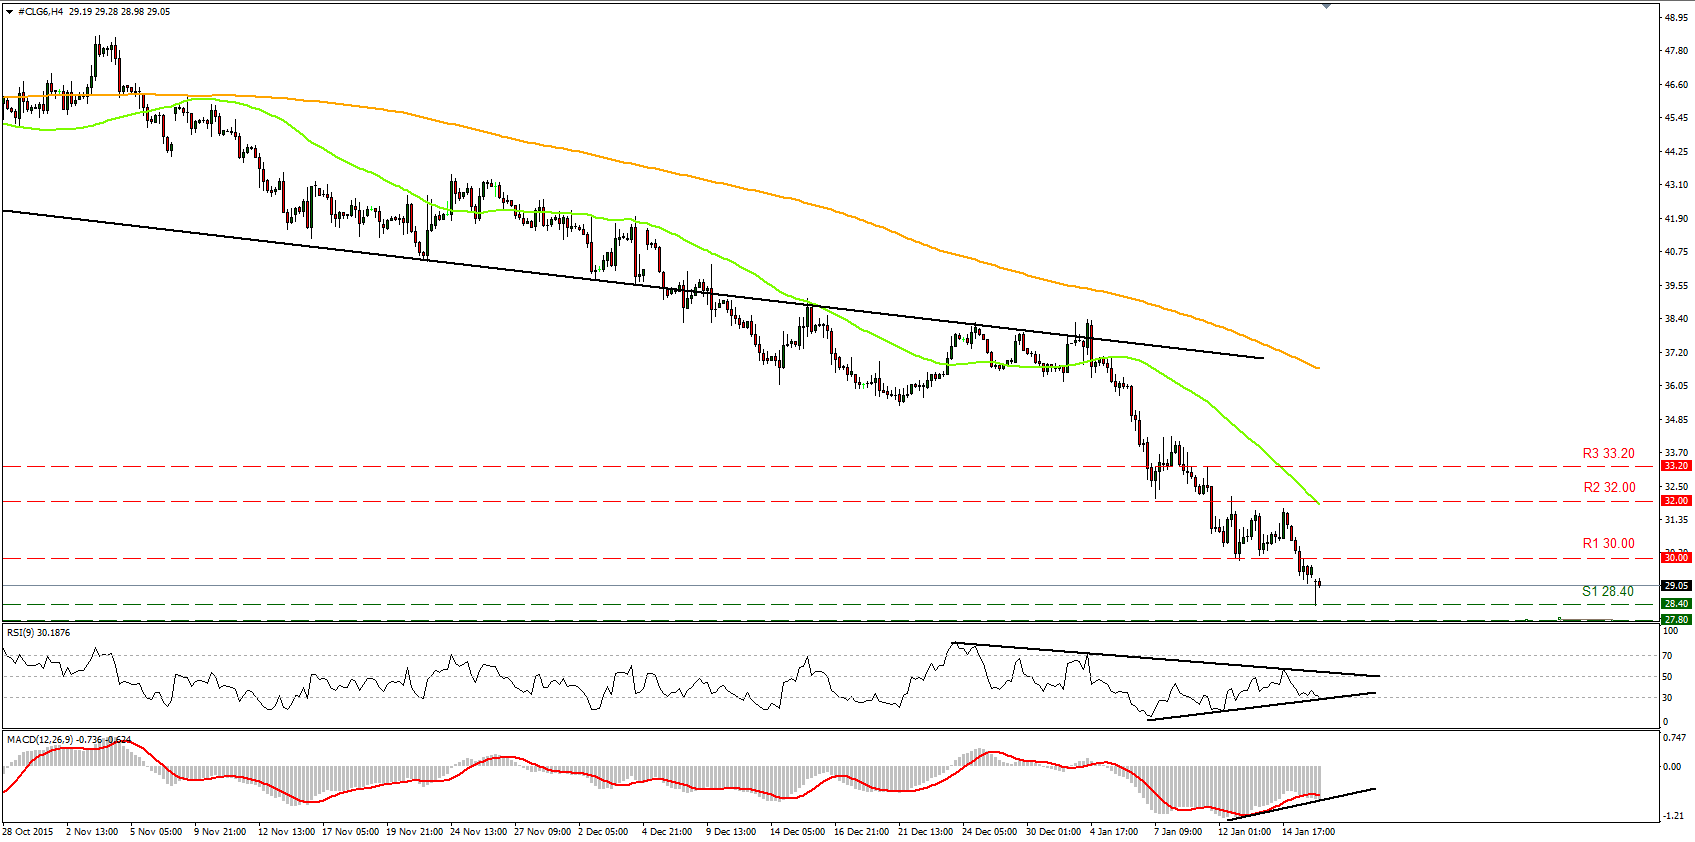
• WTI traded lower on Friday after breaking below the psychological key figure of 30.00 (R1). At its open on Monday, WTI gapped down to new cycle lows, as Iranian oil supply looms over an already over-supplied crude market. The dip below 30.00 (R1) signalled the resumption of the prevailing downtrend and is likely to trigger further declines. Looking at our short-term oscillators though, I see that the RSI found support at its 30 level and the black uptrend line, while the MACD, although at its negative territory and below its trigger line, also found support at its black uptrend line. These momentum signs support the notion that WTI could correct higher before falling again. I also see positive divergence between our momentum signals and the price action and this amplifies the case that the fall in WTI is losing speed and we could see a rebound in the foreseeable future. On the daily chart, I see that WTI has been printing lower peaks and lower troughs since the 9th of October. As a result, I would consider the longer-term picture to stay negative as well.
• Support: 28.40 (S1), 27.80 (S2), 26.85 (S3)
• Resistance: 30.00 (R1), 32.00 (R2), 33.20 (R3)
DAX futures slide below 9600
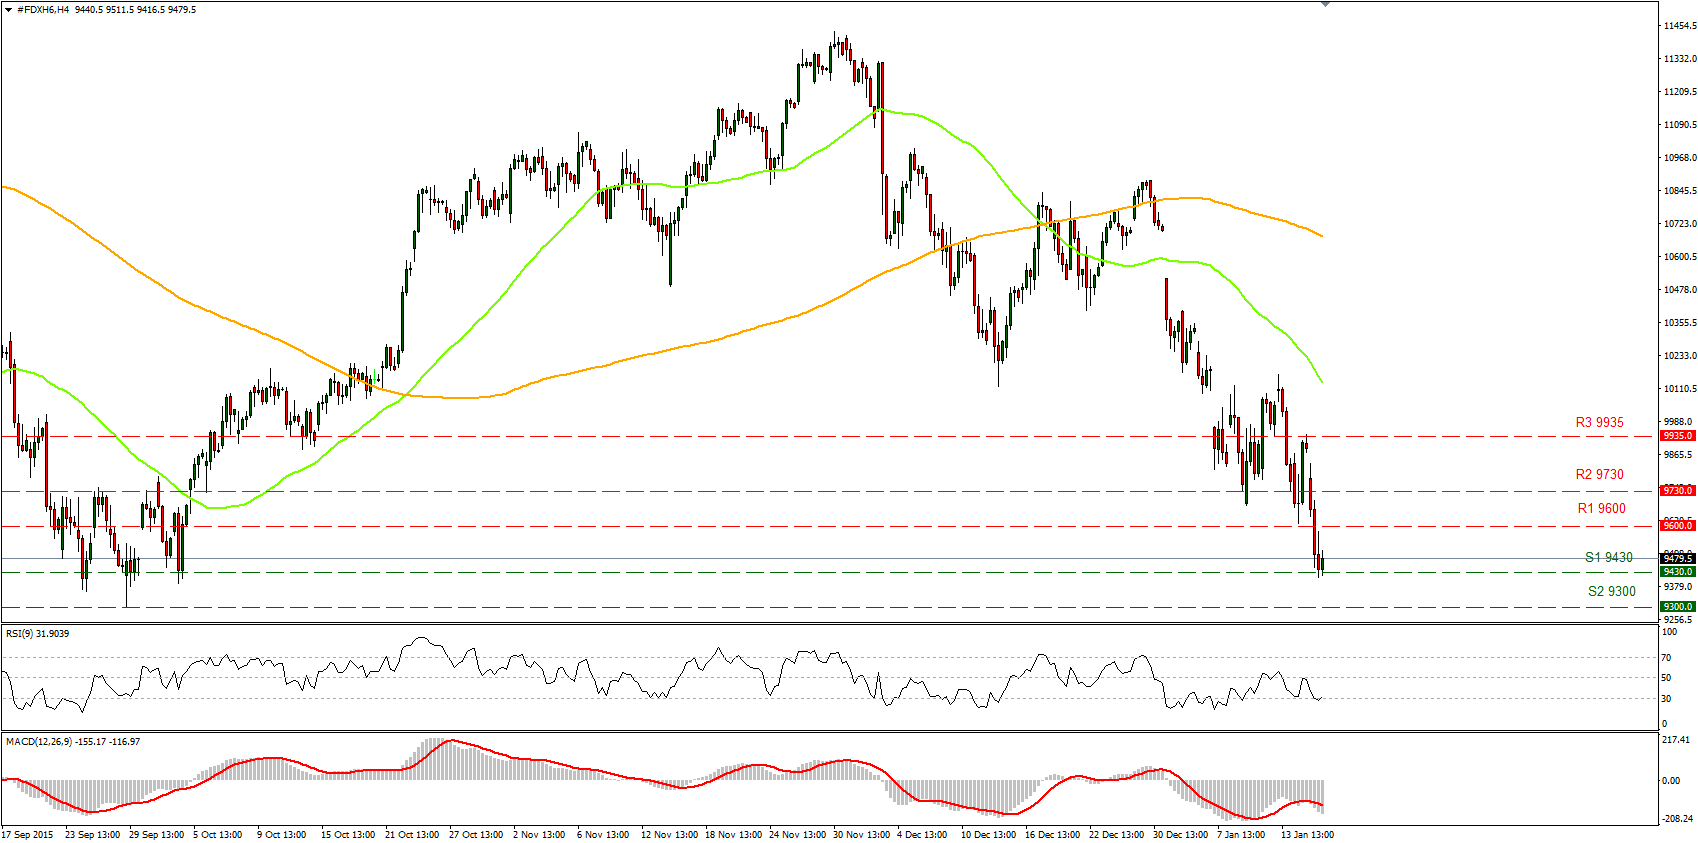
• DAX futures fell sharply on Friday after breaking below the 9600 (R1) support-turned-into-resistance barrier. The decline was stopped by the 9430 (S1) support level, where a clear break is likely to set the stage for more bearish extensions, perhaps towards the next support zone of 9300 (S2). Our short-term oscillators reveal negative momentum and support the notion. The RSI edged down after it hit resistance at its 50 line, while the MACD, already negative, has crossed below its trigger line. On the daily chart, I see that since the 1st of December the index has been printing lower peaks and lower troughs, something that keeps the longer-term picture negative as well.
• Support: 9430 (S1), 9300 (S2), 9130 (S3)
• Resistance: 9600 (R1), 9730 (R2), 9935 (R3)

