
O’Reilly Automotive Inc.’s (NASDAQ:ORLY) reported adjusted earnings of $2.60 per share in the first quarter of 2017, missing the Zacks Consensus Estimate of $2.88. Earnings including a one time benefit from the adoption of a new accounting standard came in at $2.83, up 9.3% from $2.59 recorded in the prior-year period. Net income improved 4% to $265 million (12.3% of sales) from $255 million (12.2% of sales) in the first quarter of 2016.
Quarterly revenues went up 3% to $2.16 billion from $2.10 billion a year ago. However, revenues missed the Zacks Consensus Estimate of $2.22 billion. Comparable store sales increased 0.8% in the reported quarter compared with a 6.1% rise in the prior-year quarter.
Gross profit rose 3% to $1.13 billion (52.5% of sales) from $1.10 billion (52.4% of sales) a year ago. Selling, general and administrative expenses increased 7% year over year to $728 million (33.8% of sales) from $679 million (32.4% of sales). Operating income went down 4% to $403 million (18.7% of sales) from $419 million (20% of sales) a year ago.
Store Information
During the first quarter of 2017, O’Reilly opened 60 stores across the country and closed one. Total store count was 4,888 as of Mar 31, 2017. Sales per weighted-average store decreased to $440,000 from $452,000 in the first quarter of 2016.
Share Repurchases
During the first quarter of 2017, O’Reilly repurchased 1.8 million shares for $490 million, reflecting an average price of $268.09. Subsequent to the end of the first quarter through Apr 26, it bought back 0.3 million shares for $76 million, implying an average price of $259.18.
Since the inception of the share repurchase program in Jan 2011, O’Reilly has repurchased a total of 59.1 million shares for $7.43 billion, indicating an average price of $125.75. As of Apr 26, 2017, the company had $322 million remaining under its current share repurchase authorization.
O'Reilly Automotive, Inc. Price, Consensus and EPS Surprise
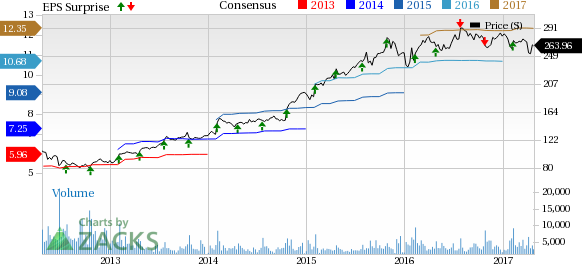
O'Reilly Automotive, Inc. Price, Consensus and EPS Surprise | O'Reilly Automotive, Inc. Quote
Financial Position
O’Reilly had cash and cash equivalents of $27.5 million as of Mar 31, 2017, compared with $716 million as of Mar 31, 2016. Long-term debt was $2 billion as of Mar 31, 2017, compared with $1.9 billion as of Mar 31, 2016.
In the first quarter of 2017, net cash flow from operations decreased to $376.7 million from $503.1 million a year ago. Meanwhile, capital expenditures rose to $110.6 million from $104 million in first-quarter 2016. Free cash flow in the period was $242.8 million compared with $384.4 million in the first quarter of 2016.
Guidance
For the second quarter of 2017, O’Reilly projects earnings per share in the range of $3.10–$3.20. The company expects consolidated comparable store sales to increase 3–5%.
For full-year 2017, the company reiterated its projections. It expects earnings per share in the band of $12.05–$12.15. O’Reilly projects consolidated comparable store sales increase in the range of 3–5% during the year. The company anticipates revenues in the band of $9.1–$9.3 billion. For 2017, the gross margin guidance is in the range of 52.8–53.2% and operating margin is expected to be 20.1–20.5%.
O’Reilly expects capital expenditures in the range of $470–$500 million and free cash flow between $930 million and $980 million for the year.
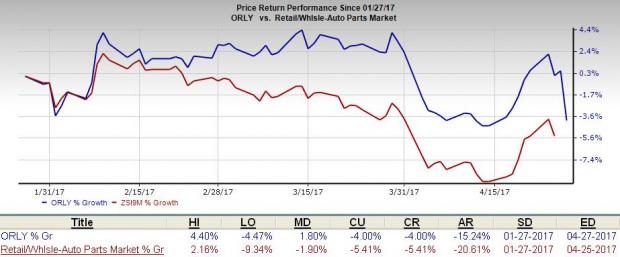
Price Performance
O’Reilly has outperformed the Zacks categorized Automotive - Retail and Wholesale – Parts industry in the last three months. The company posted a 4% decline over this period, compared with the industry’s fall of 5.4%. While the performance was supported by raised guidance for the first quarter, the weak results are expected to adversely impact the share price.
Zacks Rank & Key Picks
O’Reilly currently carries a Zacks Rank #4 (Sell).
Better-ranked companies in the auto space include Oshkosh Corporation (NYSE:OSK) , Fox Factory Holding Corp (NASDAQ:FOXF) and Lear Corporation (NYSE:LEA) . All the stocks carry a Zacks Rank #2 (Buy). You can see the complete list of today’s Zacks #1 Rank (Strong Buy) stocks here.
Oshkoshhas an expected long-term growth rate of 10.6%.
Fox Factory has an expected long-term growth rate of around 16.1%.
The expected long-term growth rate for Lear is pegged at 8.9%.
Zacks' Top 10 Stocks for 2017
In addition to the stocks discussed above, would you like to know about our 10 finest buy-and-hold tickers for the entirety of 2017? Who wouldn't? Last year's market-beating Top 10 portfolio produced 5 double-digit winners. For example, oil and natural gas giant Pioneer Natural Resources and First Republic Bank racked up stellar gains of +44.9% and +44.3% respectively. Now a brand-new list for 2017 has been hand-picked from 4,400 companies covered by the Zacks Rank. See the 2017 Top 10 right now>>
Fox Factory Holding Corp. (FOXF): Free Stock Analysis Report
O'Reilly Automotive, Inc. (ORLY): Free Stock Analysis Report
Lear Corporation (LEA): Free Stock Analysis Report
Oshkosh Corporation (OSK): Free Stock Analysis Report
Original post
Zacks Investment Research