NZD/USD Edges Lower
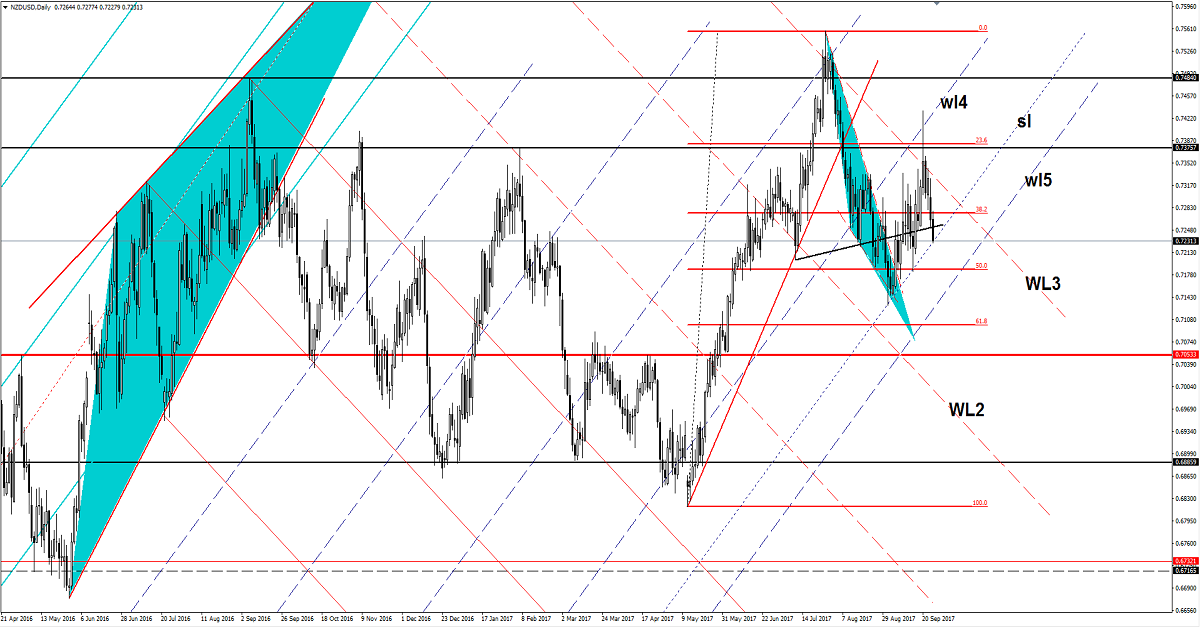
The currency pair has dropped sharply today and resumes the bearish momentum. It seems too heavy to be stopped right now even if the USDX is bloodless. The USDX drags the pair down, but remains to see what will happen because has reached a dynamic support. Technically, it should take out the downside obstacle after the false breakout above a strong dynamic resistance.
Price is trading in the red and seems unstoppable, a further US Dollar's increase will force the pair to hit fresh new lows in the upcoming period.
The USDX has managed to jump above the 92.49 static resistance, but we still need a confirmation that will really climb towards fresh new highs. USDX move sideways on the short term, this could be an accumulation and could bring us a larger rebound.
Price is pressuring the sliding parallel line (sl), which represents an important dynamic support. NZD/USD is trading in the red and is expected to ignore the mentioned support level and to approach and reach the 50% retracement level. We have an important downside target at the fifth warning line (wl5) as well. Actually, it could be attracted by the confluence area formed between the 50% Fibonacci line with the fifth warning line (wl5).
Now is trapped within an ascending channel, but a breakdown below the sliding line (sl) will confirm a further drop in the upcoming period.
USD/CAD Little Changed
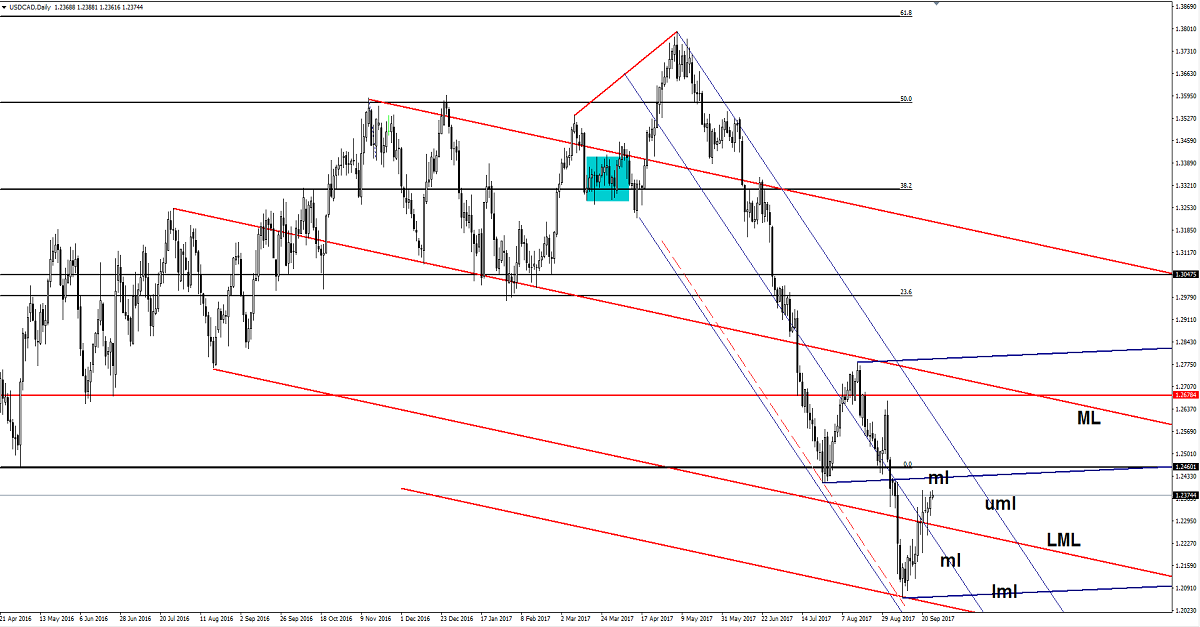
Price increased today, but it seems like is losing the bullish momentum. USD/CAD is still trading below the 1.2389 Wednesday’s high. The next upside target will be at the median line (ml) of the blue ascending pitchfork. USD/CAD is still under pressure as long a is trading within the descending pitchfork’s body. We’ll have a broader increase only after a valid breakout from the minor descending pitchfork’s body.
Brent Oil Slips Lower
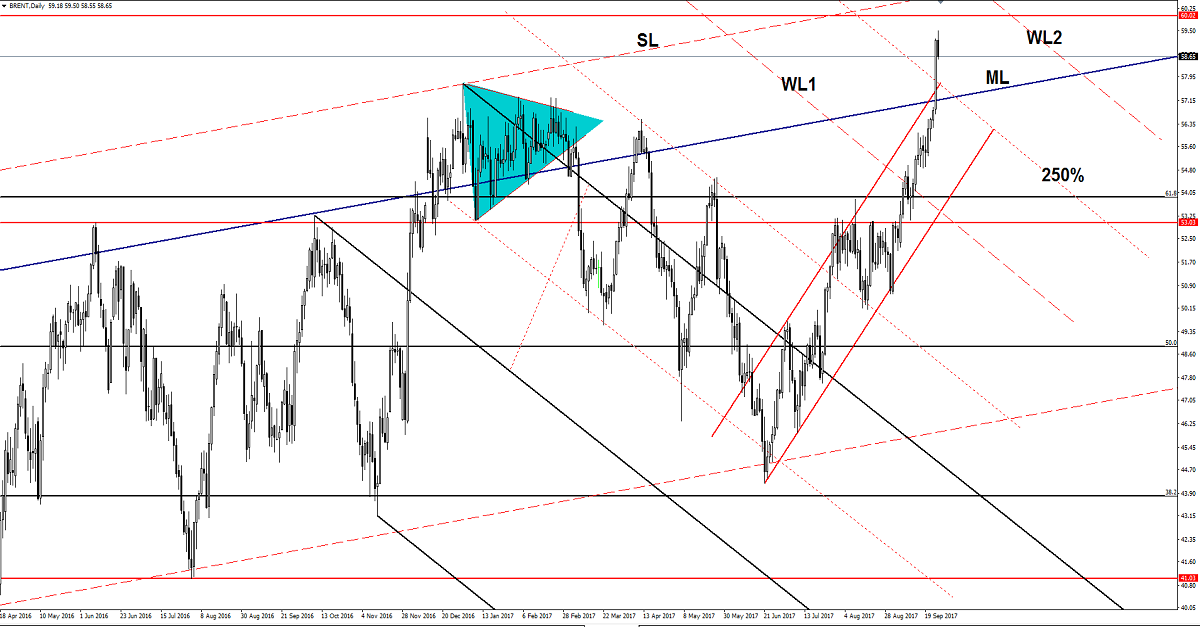
Brent Oil drops after the impressive rally failing to stabilize above the $59.00 per barrel. The minor correction is natural, it could come to retest the 250% Fibonacci line and the median line (ML) of the major ascending pitchfork before will resume the upside journey.
Risk Disclaimer: Trading, in general, is very risky and is not suited for everyone. There is always a chance of losing some or all of your initial investment/deposit, so do not invest money you can’t afford to lose. You are strongly advised to carry out your independent research before making any trading decisions. All the analysis, market reports posted on this site are only educational and do not constitute an investment advice or recommendation to open or close positions on international financial markets. The author is not responsible for any loss of profit or damage which may arise from transactions made based on any information on this website.


