Get 40% Off
🚨 Volatile Markets? Find Hidden Gems for Serious OutperformanceFind Stocks Now

NZD/JPY Collapses On Historically Low Business Confidence

Published 08/30/2018, 02:53 PM
Updated 05/14/2017, 06:45 AM

What's a trend?

There are countless ways to answer that question, but I’ve always been partial to perhaps the simplest definition:

  • an uptrend is when an asset moves from the lower left to the upper right corner of the chart, and a downtrend is when it moves from the upper left to the lower right corner.

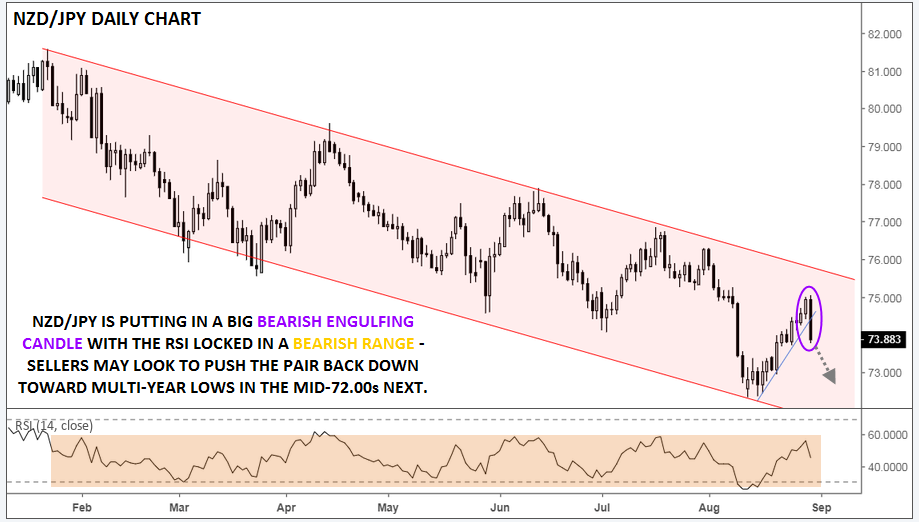
By that definition, NZD/JPY has undoubtedly been a in a downtrend through this year. The cross reached a peak around 81.50 back in late January and has been consistently grinding lower since then, shedding over 900 pips by the middle of this month. Rates have spent the last two weeks rallying off the lows, but the data released in Thursday’s Asian session led to a violent reversal back in the direction of the dominant downtrend.

Troubling Data

Overnight, the ANZ Business Confidence survey for August printed at -50.3, its lowest reading. Measures like this, while occasionally noisy, provide a leading indicator of economic health given businesses’ sensitivity to minute changes in underlying business conditions. The survey has now shown business confidence falling for six consecutive months; combined with the continued decline in Global Dairy Trade auction prices, there’s plenty for NZD bulls (and the RBNZ!) to worry about.

Turning our attention back to the chart, NZD/JPY has sliced through its corrective trend line, forming a big bearish engulfing candle in the process. This price action shows a dramatic shift to near-term selling pressure and suggests that the longer-term downtrend has resumed. Meanwhile, the RSI has been locked in a bearish range between 30 and 60 for the last seven months.

3rd party Ad. Not an offer or recommendation by Investing.com. See disclosure here or remove ads .

Moving forward, bears may look to push the pair the unit back toward the mid-month lows in the mid-72.00s, which also represents longer-term lows from back in 2015 and 2016.
NZD/JPY

Source: TradingView, FOREX.com

Cheers

Latest comments

Risk Disclosure: Trading in financial instruments and/or cryptocurrencies involves high risks including the risk of losing some, or all, of your investment amount, and may not be suitable for all investors. Prices of cryptocurrencies are extremely volatile and may be affected by external factors such as financial, regulatory or political events. Trading on margin increases the financial risks.
Before deciding to trade in financial instrument or cryptocurrencies you should be fully informed of the risks and costs associated with trading the financial markets, carefully consider your investment objectives, level of experience, and risk appetite, and seek professional advice where needed.
Fusion Media would like to remind you that the data contained in this website is not necessarily real-time nor accurate. The data and prices on the website are not necessarily provided by any market or exchange, but may be provided by market makers, and so prices may not be accurate and may differ from the actual price at any given market, meaning prices are indicative and not appropriate for trading purposes. Fusion Media and any provider of the data contained in this website will not accept liability for any loss or damage as a result of your trading, or your reliance on the information contained within this website.
It is prohibited to use, store, reproduce, display, modify, transmit or distribute the data contained in this website without the explicit prior written permission of Fusion Media and/or the data provider. All intellectual property rights are reserved by the providers and/or the exchange providing the data contained in this website.
Fusion Media may be compensated by the advertisers that appear on the website, based on your interaction with the advertisements or advertisers.
© 2007-2024 - Fusion Media Limited. All Rights Reserved.