
The high-flying Kiwi has pushed up to the 84 cent mark overnight, and has started to look like it might turn back after touching heavy resistance at 0.8390.
 NZD/USD 1" title="NZD/USD 1" height="242" width="474">
The New Zealand dollar has a relatively light week ahead of itself, as the only news due out is for Wednesday late in the evening. With that being said, it’s unlikely much can move the New Zealand dollar out of its current range, as it continues to range between the 80-84 cent range. Despite core retail sales missing forecasts for the month of Janurary (1.2% v 1.4%), markets are still upbeat about the success of the NZ economy, which has become the tiger of the south pacific.
Despite the small amount of data due out, it's likely it won’t have any massive impacts, as a solid economic result for the most part is priced in, and we have seen very little movement of the recent consumer confidence data. What would move the NZD though, is US data or a poor economic result from one of the economic releases.
Despite the fundamentals, it’s important to also pay attention to the technical aspect and the NZD certainly likes technicals - especially on the smaller hour charts. But that’s not to say you should ever neglect the daily which is very useful in deriving direction.
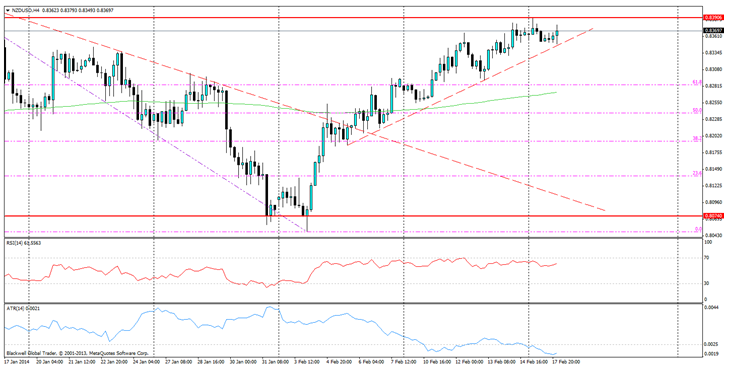
Current market technicals show heavy resistance at 0.8390 as previously mentioned. It’s unlikely this will break unless we see some major economic news. If anything, a move lower is much more applicable for the NZDUSD pair which has bounced off this mark six times in the last 5 months.
Currently, the RSI indicator points to heavy buying, which is bullish, while the ATR is currently showing that volatility is very low and that interest might be waning for any further higher movements, and we won’t see any increase until traders see the markets move lower. I have set 0.025 as my range to signal movements as volatility is extremely low, and a push upwards would certainly paint a clear signal of an impending movement.
Certainly, any movement lower will look for support, and the 61.8 fib mark is looking like the first major level of support, while in the current stage, the trend line is likely to act as support until markets look to test it and push through.

Support levels can be found at 0.8334, 0.8282 (61.8 fib) and 0.8238 (50.0 fib). These are likely to be strong, but as mentioned previously, the 61.8 fib level will act as the hardest level to push through when the pair drifts lower.
Overall, the NZD is an easy to watch currency that ranges heavily over the weeks. If anything, markets should pay attention, as anything above the 85 cent mark never holds for very long, and the resistance at play is very strong. I know I will certainly be watching in the coming days as the NZD/USD looks to profit talk and drift lower.