Get 40% Off
👀 👁 🧿 All eyes on Biogen, up +4,56% after posting earnings. Our AI picked it in March 2024.
Which stocks will surge next?
Unlock AI-picked Stocks

Nvidia Stays In Uptrend Mode After Arm Deal

Published 09/15/2020, 07:06 AM
Updated 07/09/2023, 06:31 AM

The Nvidia stock (NASDAQ: NASDAQ:NVDA) opened with a positive gap on Monday, following headlines that the firm is planning to buy the UK-based chip designer Arm from Japan’s SoftBank Group Corp for as much as USD 40bn. This means that Nvidia is likely to be the first to hit the market with the latest Arm designs, leaving its competitors at the back of the queue.

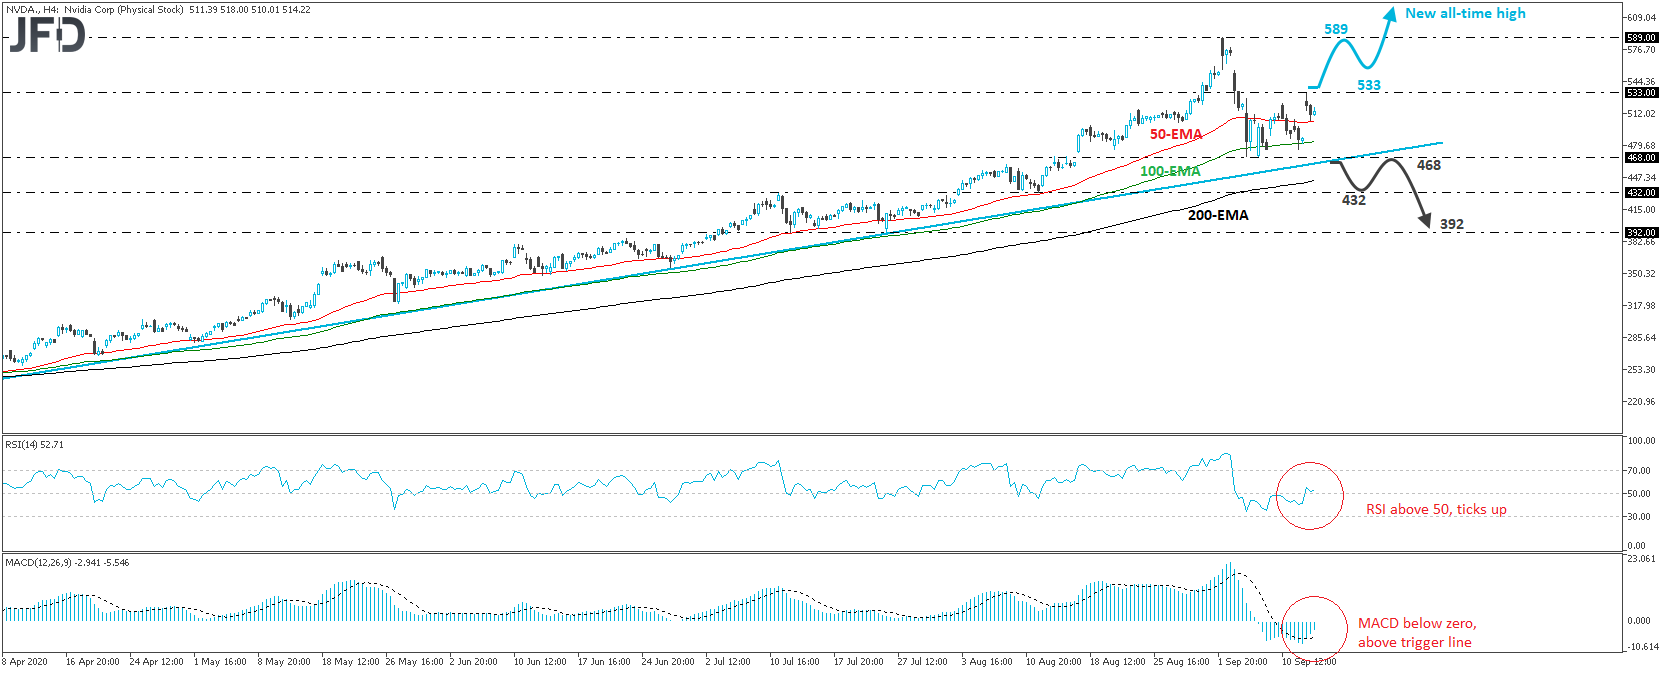
From a technical standpoint, we see that the price structure on the 4-hour chart continues to suggest an uptrend, marked by an upside support line drawn from the low of April 3rd. Although the price fell sharply after it hit its record of 589 on September 2nd, investors and traders managed to keep it above that upside line, which in our view maintains the near-term outlook positive.

Monday’s positive gap adds more credence to that view, but in order to get more confident on further advances, we would like to see a break above Monday’s high, at 533. Such a move may encourage the bulls to drive the battle up, for another test near the stock’s record high of 589, the break of which would take the price into unchartered territory. Given that we cannot mark resistance levels from prior peaks and prior troughs, we would consider as the next important territories the psychological zones of 600 and 650.

Looking at our short-term oscillators, we see that the RSI lies above 50 and has just ticked up again, while the MACD, although negative, lies above its trigger line, pointing north as well. Both indicators suggest that Nvidia may have started to gain positive momentum again, which corroborates the trend-continuation case.

3rd party Ad. Not an offer or recommendation by Investing.com. See disclosure here or remove ads .

Now, in case the stock slips below the aforementioned upside line, as well as below the key support of 468, marked by the lows of September 4th and 8th, we will abandon the bullish case and start examining a possible trend reversal, as such a move will confirm a forthcoming lower low on both the 4-hour and daily charts. Investors may allow the price to fall towards the low of August 11th, at 432, the break of which could extend the slide towards the 392 territory. That zone provided decent support on July 14th and 24th.
Nvidia stock 4-hour chart technical analysis

Latest comments

Risk Disclosure: Trading in financial instruments and/or cryptocurrencies involves high risks including the risk of losing some, or all, of your investment amount, and may not be suitable for all investors. Prices of cryptocurrencies are extremely volatile and may be affected by external factors such as financial, regulatory or political events. Trading on margin increases the financial risks.
Before deciding to trade in financial instrument or cryptocurrencies you should be fully informed of the risks and costs associated with trading the financial markets, carefully consider your investment objectives, level of experience, and risk appetite, and seek professional advice where needed.
Fusion Media would like to remind you that the data contained in this website is not necessarily real-time nor accurate. The data and prices on the website are not necessarily provided by any market or exchange, but may be provided by market makers, and so prices may not be accurate and may differ from the actual price at any given market, meaning prices are indicative and not appropriate for trading purposes. Fusion Media and any provider of the data contained in this website will not accept liability for any loss or damage as a result of your trading, or your reliance on the information contained within this website.
It is prohibited to use, store, reproduce, display, modify, transmit or distribute the data contained in this website without the explicit prior written permission of Fusion Media and/or the data provider. All intellectual property rights are reserved by the providers and/or the exchange providing the data contained in this website.
Fusion Media may be compensated by the advertisers that appear on the website, based on your interaction with the advertisements or advertisers.
© 2007-2024 - Fusion Media Limited. All Rights Reserved.