Nu Skin Enterprises, Inc. (NUS) is a global direct selling company with operations in 52 markets worldwide. The Company develops and distributes anti-aging personal care products and nutritional supplements under its Nu Skin and Pharmanex brands, respectively.
I found this stock using the real-time custom scan that searches for high vols relative to the short-term and long-term historical realized vol. But, there’s an interesting phenomenon here with a recent earnings move. Let’s start with the custom scan details:
Custom Scan Details
Stock Price GTE $7 and LTE $70
IV30™ - HV20™ LTE 10
HV180™ - IV30™ LTE -8
Average Option Volume GTE 1,200
Industry isNot Bio-tech
Days After Earnings GTE 10 and LTE 60
The goal with this scan is to identify short-term implied vol (IV30™) that is elevated both to the recent stock movement (HV20) and the long term trend in stock movement (HV180). I'm also looking for a reasonable amount of liquidity in the options (thus the minimum average option volume), want to avoid bio-techs (and their crazy vol) and make sure I'm not selling elevated IV30™ simply because earnings are approaching.
--- ANALYSIS ---
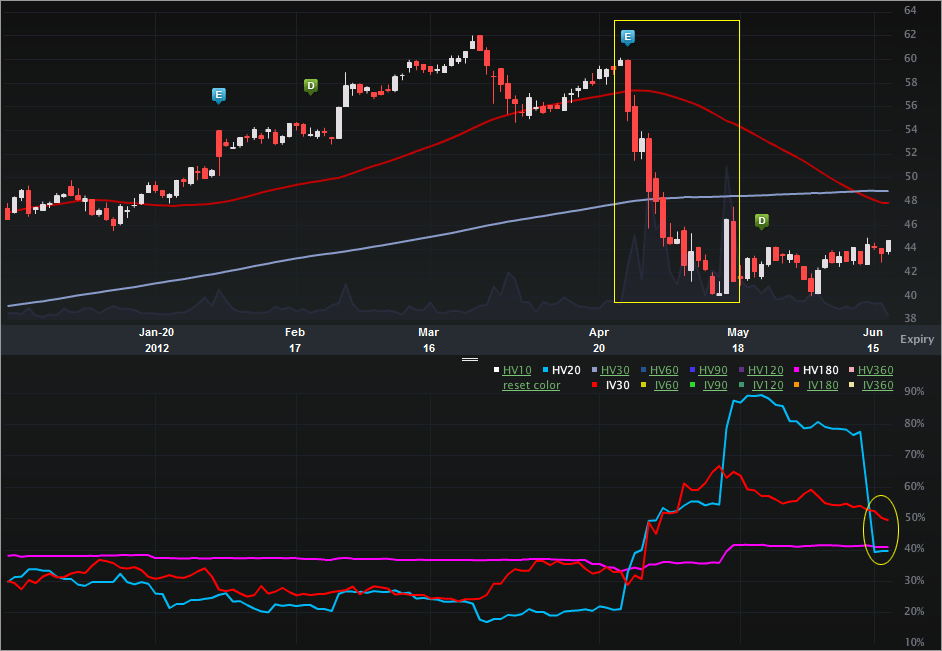
The NUS Charts Tab (six months) is included below. The top portion is the stock price, the bottom is the vol (IV30™ - red vs HV20™ - blue vs HV180™ - pink).
On the stock side, we can see how this stock dropped from just under $60 on 4-25-2012, to just over $40 on 5-22-2012. The catalyst was the earnings report on 4-26-2012 (BMO). Oddly, the company beat on both top and bottom line numbers, but the stock saw an abrupt drop. The price continued to fall as HLF also reported record earnings, but a noted short-seller asked questions on the earnings call. By noted short-seller I mean Greenlight Capital’s David Einhorn – the guy who called Lehman out on dubious accounting a year before it disappeared, and the guy who called GMCR out right before the 70% drop. Source: Seeking Alpha via Yahoo! Finance; Are These David Einhorn's Newest Targets?, written by Lou Basenese.
In that same article, we read some disturbing realities about HLF and NUS:
Per SEC filings, Herbalife bills itself as “a leading global nutrition company that sells weight management, nutritional supplements, energy, sports & fitness products and personal care products utilizing network marketing distribution.”
And Nu Skin bills itself as “a leading, global direct selling company that develops and distributes premium-quality, innovative personal care products and nutritional supplements.”
Let’s be honest, though. “Network marketing distribution” and “global direct selling” are nothing more than euphemisms for a pyramid scheme. The data confirms it, too.
The overwhelming majority of distributors at Herbalife (90%) and Nu Skin (95%) didn’t turn a profit in 2011. These figures are in line with exposés in Newsweek, USA Today and Britain’s The Times on other popular pyramid schemes.
The only ones that make money are those at the top. Like Herbalife’s CEO, Michael O. Johnson. He was the highest paid CEO last year, earning $89 million, according to Barron’s.
That doesn’t sound very good…
Throughput the 50% (ish) drop in NUS over less than a month, the news headlines were rather positive – increasing a share repurchase program.
Then, the price action got even more whacky. On 5-16-212, the stock rose from $40.22 to $46.46. The next day, it dropped back to $41.24. From what I gather by reading the news, there was anticipation that Einhorn would mention NUS (and HLF) as a short sale but didn’t (thus the stock rise). The stock then dropped the next day because... Well, I don’t really know why.
The vol side also has an interesting recent evolution. The implied reached an annual high on 5-1-5-2012, the day before the two-day pop drop wackiness. But since then, the IV30™ has dropped to 49.52% as the stock has found a quiet period. In fact, HV10™ is just 37.70%. Now that the 5-16/5-17 moves have rolled off of the HV20™, the implied is elevated to the near-term historical realized vol measures as well as the longer-term trend. Specifically:
IV30™: 49.52%
HV20™: 39.67%
HV180™: 41.10%
The 52 wk range in IV30™ is [23.82%, 66.79%], putting the current level in the 60th percentile.
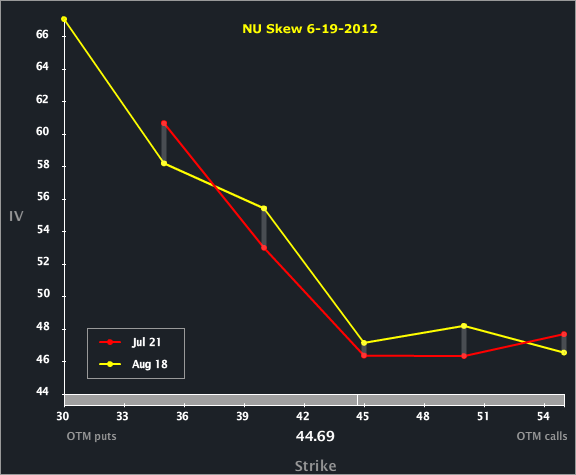
Let's turn to the Skew Tab to examine the line-by-line and month-to-month vols.
The skew shape is normal, nothing too interesting. But, I do note that the Aug cycle should have the next earnings release and is essentially priced in line with Jul. That is a bit odd given the move off earnings last time. Hmmm….
--- SUMMARY --
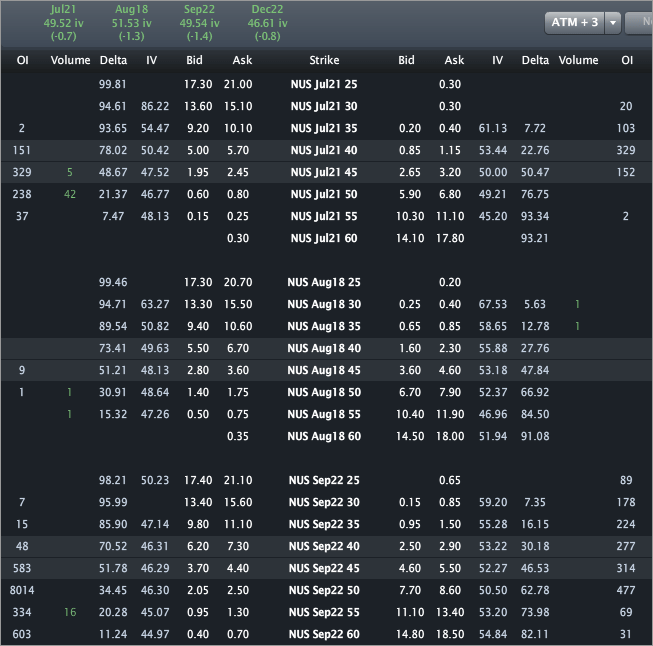
Finally, let's look to the Options Tab (below).
I wrote about this one for TheStreet (OptionsProfits), so no specific trade analysis here. Across the top we can see that Jul is priced to 49.52%, while Aug is priced to 51.53%. Again, that could be seen as a relatively small vol diff given the move off of last earnings. Ultimately, while the vol level triggered a “high vol” scan, this doesn’t exactly seem like a sale. While the implied is trading above the HV10™ and HV20™, the reaction that the underlying had to the possibility of Einhorn short sales points to rather unsettling instability.
DISCLAIMER: This is trade analysis, not a recommendation.
- English (UK)
- English (India)
- English (Canada)
- English (Australia)
- English (South Africa)
- English (Philippines)
- English (Nigeria)
- Deutsch
- Español (España)
- Español (México)
- Français
- Italiano
- Nederlands
- Português (Portugal)
- Polski
- Português (Brasil)
- Русский
- Türkçe
- العربية
- Ελληνικά
- Svenska
- Suomi
- עברית
- 日本語
- 한국어
- 简体中文
- 繁體中文
- Bahasa Indonesia
- Bahasa Melayu
- ไทย
- Tiếng Việt
- हिंदी
NU Skin: Elevated Vol, Unsettling Instability.
Published 06/20/2012, 04:45 AM
Updated 07/09/2023, 06:31 AM
NU Skin: Elevated Vol, Unsettling Instability.
3rd party Ad. Not an offer or recommendation by Investing.com. See disclosure here or
remove ads
.
Latest comments
Install Our App
Risk Disclosure: Trading in financial instruments and/or cryptocurrencies involves high risks including the risk of losing some, or all, of your investment amount, and may not be suitable for all investors. Prices of cryptocurrencies are extremely volatile and may be affected by external factors such as financial, regulatory or political events. Trading on margin increases the financial risks.
Before deciding to trade in financial instrument or cryptocurrencies you should be fully informed of the risks and costs associated with trading the financial markets, carefully consider your investment objectives, level of experience, and risk appetite, and seek professional advice where needed.
Fusion Media would like to remind you that the data contained in this website is not necessarily real-time nor accurate. The data and prices on the website are not necessarily provided by any market or exchange, but may be provided by market makers, and so prices may not be accurate and may differ from the actual price at any given market, meaning prices are indicative and not appropriate for trading purposes. Fusion Media and any provider of the data contained in this website will not accept liability for any loss or damage as a result of your trading, or your reliance on the information contained within this website.
It is prohibited to use, store, reproduce, display, modify, transmit or distribute the data contained in this website without the explicit prior written permission of Fusion Media and/or the data provider. All intellectual property rights are reserved by the providers and/or the exchange providing the data contained in this website.
Fusion Media may be compensated by the advertisers that appear on the website, based on your interaction with the advertisements or advertisers.
© 2007-2024 - Fusion Media Limited. All Rights Reserved.
