Get 40% Off
💰 Warren Buffett reveals a $6.72 billion stake in ChubbCopy Portfolios

Nowhere To Hide Last Week

Published 03/16/2020, 07:29 AM
Updated 07/09/2023, 06:31 AM
BARC
-
GSG
-
BWX
-
BND
-

The coronavirus blowback that’s roiling the world cut into every facet of the major asset classes last week, based on a set of exchange-traded funds. Another challenging week awaits, as sharp losses in overseas markets and US futures trading (ahead New York’s open for stocks) on Monday suggest.

As the US braces for more bad news in the days ahead, let’s quickly reassess how the trading week stacks up through Friday, Mar. 13. As the chart below shows, red ink prevailed across the board. The softest setback was in US investment-grade bonds. Vanguard Total US Bond Market Index (BND) tumbled 4.8%, a huge setback for this normally slow-moving ETF.

The deepest loss last week: foreign real estate/REITs. Vanguard Global ex-U.S. Real Estate (VNQI) suffered a heavy 16.5% loss.

The Global Market Index (GMI.F) was caught in the selling wave as well. This unmanaged benchmark that holds all the major asset classes (except cash) in market-value weights was crushed under a 9.4% decline last week.
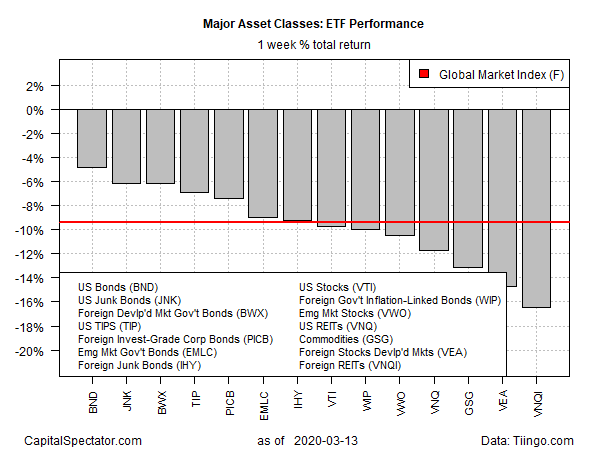
Major Asset Classes ETF Performance

For the one-year trend, only three components of the major asset classes are holding on to gains: US investment-grade bonds, US inflation-linked Treasuries and foreign government bonds in developed markets. Otherwise, red ink prevails.

Vanguard Total US Bond Market Index (NYSE:BND) is up 7.3% for the trailing one-year window through Friday’s close. Meanwhile, iShares TIPS Bond (TIP) and SPDR Bloomberg Barclays (LON:BARC) International Treasury Bond (NYSE:BWX), in second and third places, respectively, are holding on to small gains for the one-year result.

Losses dominate otherwise, all the way down to a 31.2% tumble for broadly defined commodities via iShares S&P GSCI Commodity-Indexed Trust  (NYSE:GSG).

3rd party Ad. Not an offer or recommendation by Investing.com. See disclosure here or remove ads .

GMI.F is also posting a one-year loss via a 4.1% decline at last week’s close.
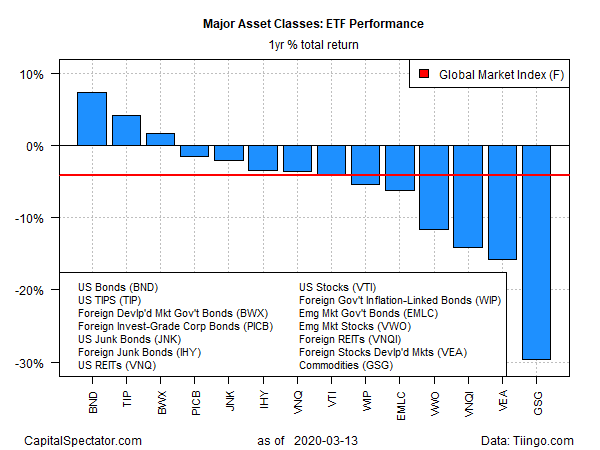
ETF Performance GMI Index - 1 Yr Total Return

Latest comments

Risk Disclosure: Trading in financial instruments and/or cryptocurrencies involves high risks including the risk of losing some, or all, of your investment amount, and may not be suitable for all investors. Prices of cryptocurrencies are extremely volatile and may be affected by external factors such as financial, regulatory or political events. Trading on margin increases the financial risks.
Before deciding to trade in financial instrument or cryptocurrencies you should be fully informed of the risks and costs associated with trading the financial markets, carefully consider your investment objectives, level of experience, and risk appetite, and seek professional advice where needed.
Fusion Media would like to remind you that the data contained in this website is not necessarily real-time nor accurate. The data and prices on the website are not necessarily provided by any market or exchange, but may be provided by market makers, and so prices may not be accurate and may differ from the actual price at any given market, meaning prices are indicative and not appropriate for trading purposes. Fusion Media and any provider of the data contained in this website will not accept liability for any loss or damage as a result of your trading, or your reliance on the information contained within this website.
It is prohibited to use, store, reproduce, display, modify, transmit or distribute the data contained in this website without the explicit prior written permission of Fusion Media and/or the data provider. All intellectual property rights are reserved by the providers and/or the exchange providing the data contained in this website.
Fusion Media may be compensated by the advertisers that appear on the website, based on your interaction with the advertisements or advertisers.
© 2007-2024 - Fusion Media Limited. All Rights Reserved.