And yet, don't blow off gold dust too lightly: hoover up enough of it and, as we'll later note, one can retire in grand style. But first:
Gold just completed a first-class week in firming the formative stages for higher levels ahead, settling Thursday at 1320 (and then in our Friday, Fourth of July-shortened session at 1321).
"Oh c'mon, mmb, a +4 change for the week can hardly be called first class..."
My dear Squire, that is precisely why we harp upon "change" as being an illusion, whereas "price" is the truth: Gold's intra-week high price of 1334 was more than sufficient for allowing us straight away to display that the weekly parabolic trend -- which after having spent a rather 13 dull weeks on the ShortSide -- has now flipped to Long per the rightmost new blue dot:
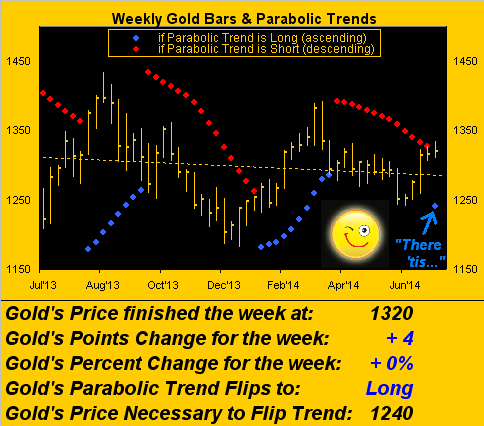
Moreover: Gold's having cleared its parabolic hurdle adds further justification for the run to a new high for the year above 1392. As you may recall a couple of weeks ago, Gold's Price Oscillator study turned positive, the daily price bars changing from red to green, from which we then offered, (per our Market Rhythms analysis), a 67% chance of price reaching at least the 1384 level...
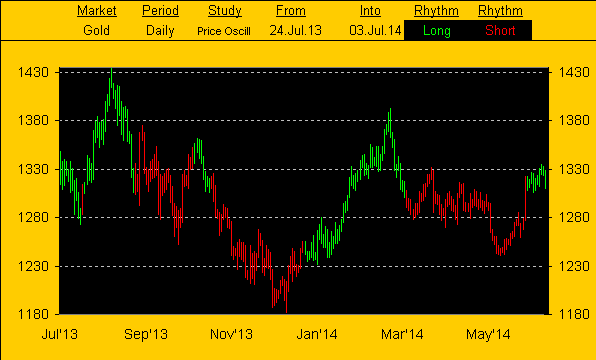
...the notion then being within the trading community of price's being so close to the year's high of 1392, that 'twill test it, which in turn being so close to the century mark of 1400, that it too 'twill be achieved. If for no other reason, 'tis how market psychology plays into price targets.
In addition, if not already exciting enough to have commenced this missive by displaying Gold's parabolic breakout to the LongSide, supported in furtherance by a Market Rhythm target which can in turn propel price back above 1400, given that we've now glided though mid-year, we're pleased to present the current BEGOS Markets standings. And as you can see, the precious metals are leading the pack:
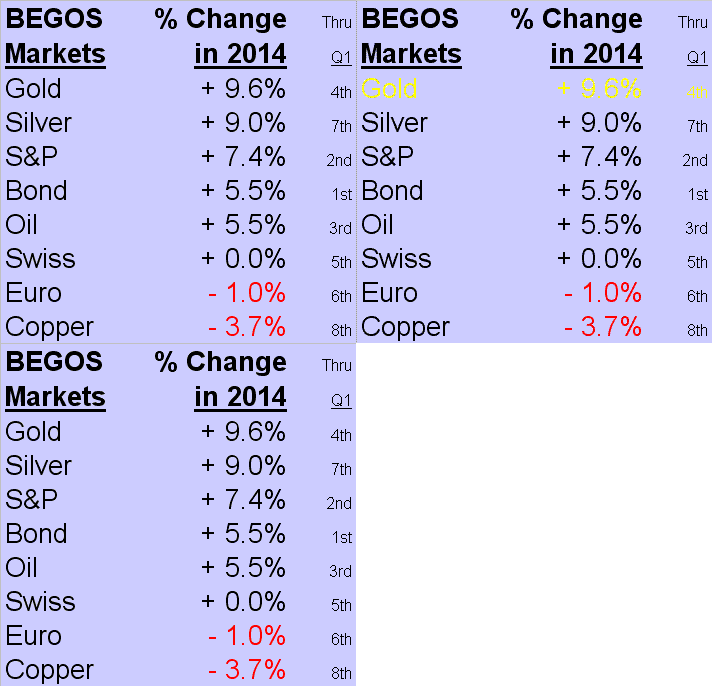
And notably therein, look at the run for Sister Silver, which per the right-hand column ranked a lowly 7th just a quarter ago. Betcha haven't seen these great markets ranked this way in your FinMedia musings, eh? No. Indeed, over this extended holiday weekend, ask your barbecue buddies which market has performed better year-to-date: Gold or Stocks? 10'll getcha 20 they'll all choose the latter.
Which brings us to the mention of "fairy dust" in this piece's title. Most of you know that I've bypassed the BubbleVision of televised financial networks for many years, in preference to reading and radio; 'tis but on the ever so rare occasion that I'll pop on the FinTélé, (and within 60 seconds then wonder why). However early Thursday with ECB President Draghi on deck, to then be soon followed by a cavalcade of incoming economic data, I took a very quick peek and -- perfectly timed by the luck of the draw -- heard one of the most common-sense observations to come out of the boob-tube in years. A popular network anchor, in actually acknowledging the uneven nature of the economic recovery, suggested that the stock market's nevertheless continuing to rise must be due to "fairy dust". (My not being able to agree more, nor risk ruining the moment, I switched off the set rather than wait for Mario).
Admittedly, the Econ Baro (below) has ratcheted back up since its sudden mid-June pothole excursion. But as we point out time and again, an S&P 500 carrying (at this writing) our calculated "live" price-earnings ratio of 32.0x, and lowly yield of 1.975% versus the "safety" of the U.S. 10-Year Treasury Note's 2.648%, is complete vindication for the anchor's analogy to "fairy dust":
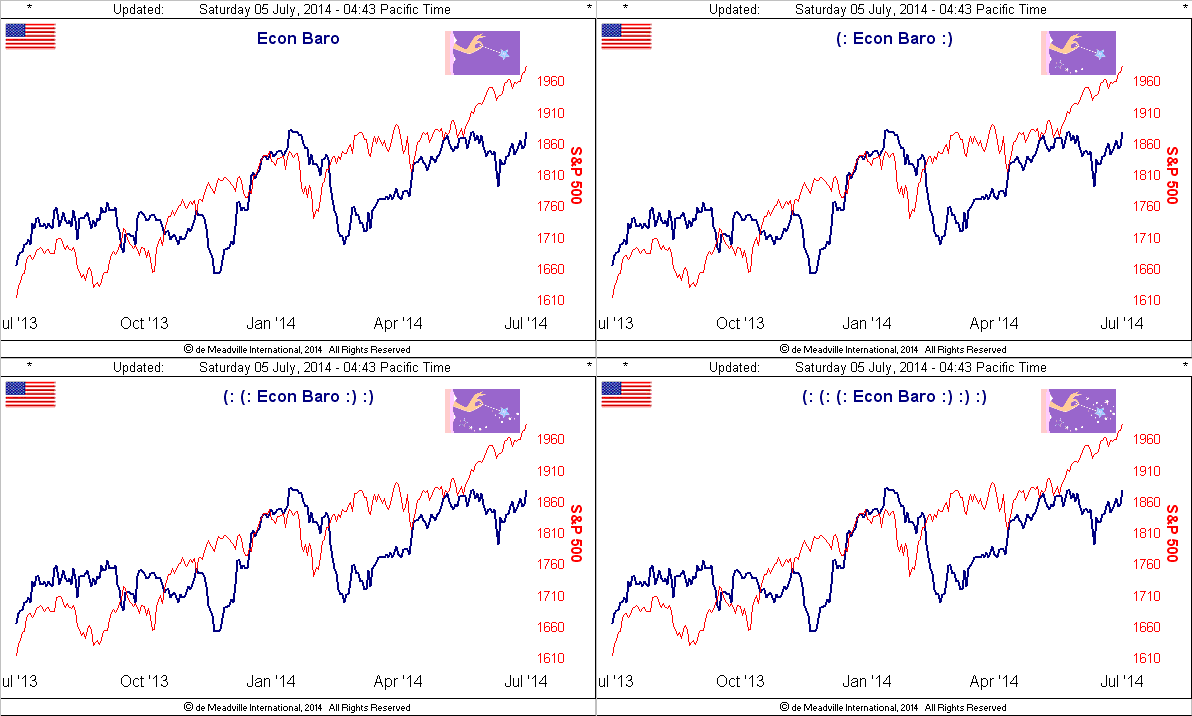
As well, given the aforementioned psychology that should Gold upon nearing 1400 then pass up through it, so 'tis same for the S&P now at 1985 to likely tap 2000. The traders shall cause it to happen. But at these disproportionate heights given unsupportive trailing earnings, and now those for Q2 ready to roll in, plus an Index yield which is 25% below that of debt -- not to mention the assuredly vast equities principal risk -- to refer to these complacently lofty stock market levels as powered even by "fairy dust" is gross understatement. Do we thus remain on crash-watch? Is there fog in San Francisco? (There used to be a mountain just outside the window here).
Now specific to Gold and all of our championing about the run to 1400, unlike the S&P, markets generally don't race to targets in a straight line. Here at 1320, Gold through just normal range movement can first easily test 1300 -- without ruining this brand-new parabolic Long trend -- before moving farther up the line. To be sure for Gold, as well as for Silver, they've established true consistency in their respective 21-day linear regression uptrends by virtue of their baby blue dots residing above the +80 levels. And yet therein, please observe just the slightest curling of those Baby Blues to the downside on these views for the last 21 days:
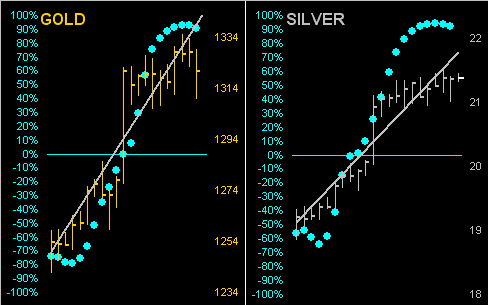
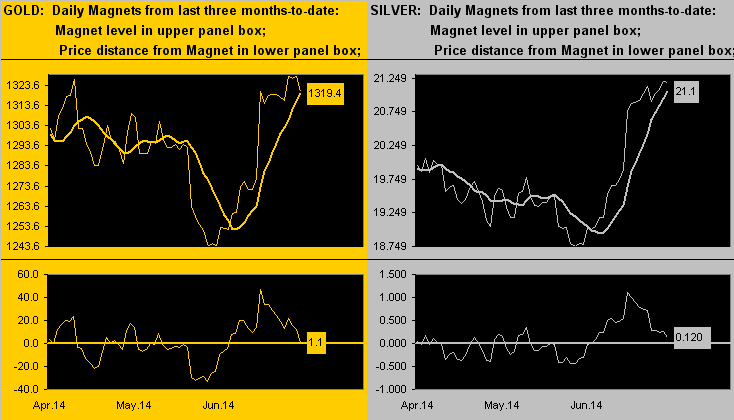
The good news is that neither Gold nor Silver are far afield from their Market Magnets, (a calculation made each day of contract volume-weighted price combined for the most recent 10 trading sessions). Here are the three-month views of these daily Magnets:
However, with respect to Gold's valuation, (the smooth pearly line in this next three-month graphic), which measures price's movements vis-à-vis those of the five primary components that comprise BEGOS, (Bond/Euro/Gold/Oil/S&P), Gold appears momentarily high, notably per the oscillator (price less valuation) in the lower panel.
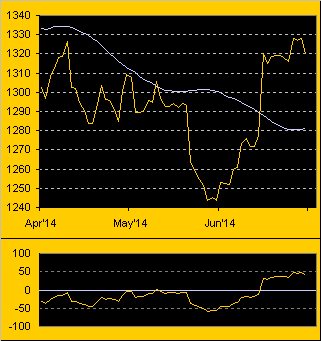
Of note is that the smooth line itself sits currently just above Gold's 1280-1240 support zone, such that a near-term dip in price sub-1300 ought not be worrisome within the context of normal price fluctuation. In fact, for those of you truly scoring at home, Gold's expected daily trading range (EDTR) is currently 15 points, and its weekly calculation is 36 points. Range cognizance conveys comfort to the trader; (the EDTRs for all the BEGOS Markets are, of course, updated daily at the website).
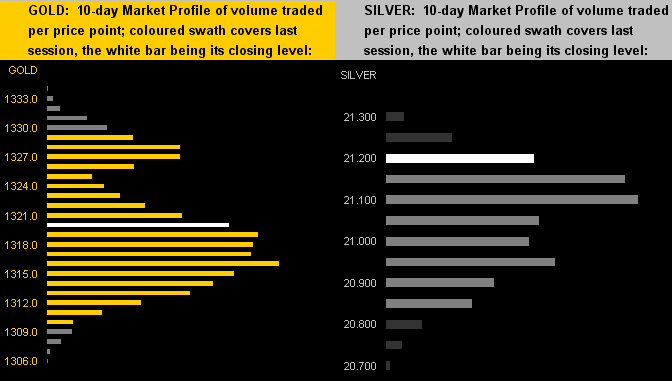
Finally, ahead of The Gold Stack, here we've the 10-day Market Profiles for both Gold and Silver. Trading resistance for the yellow metal is evident in the 1328-1327 area with support at 1316; for the white metal, support is shown at its 21.100 apex:
With Gold's weekly parabolic trend having now flipped to Long, 'tis appropriate that we therefore conclude with...
The Gold Stack:
- Gold’s All-Time High: 1923 (06 September 2011)
- The Gateway to 2000: 1900+
- The Final Frontier: 1800-1900
- The Northern Front: 1750-1800
- On Maneuvers: 1579-1750
- Structural Resistance: 1479 / 1524-1535
- The Floor: 1466-1579
- Le Sous-sol: Sub-1466
- Year-to-Date High: 1392
- Base Camp: 1377
- Trading Resistance: 1327-1328
- Gold Currently: 1320, (weighted-average trading range per day: 15 points)
- 10-Session “volume-weighted” average price magnet: 1319
- Trading Support: 1316
- The 300-day Moving Average: 1310
- 10-Session directional range: 1305 up to 1335 = +30 points or +2%
- Neverland: The Whiny 1290s
- Support Band: 1280-1240
- Structural Support: 1266 / 1227 / 1163 / 1145
- The Weekly Parabolic Price to flip Short: 1240
- Year-to-Date Low: 1203
As we head out to frolic in our freezing summertime fog, this brief note per our opening paragraph as regards Gold dust. 'Tis not to be taken lightly. Back in 2012, a team installing a California home's ventilation system came across a jar of Gold dust. The purported value? $300,000. Then later that year, a medical research lab in Missouri reported some $700,000 in Gold dust as having gone missing. The moral? "Back off Gold dust woman..." (Fleetwood Mac, '77). Hang onto your flecks, Folks!
The ensuing week is fairly subdued in terms of scheduled incoming economic data, albeit as noted we'll be receiving the initial doses of Q2 Earnings Season results as well as the FOMC Minutes from its June meeting. I 'spect we'll see the S&P tap 2000, whilst a wee pullback in Gold wouldn't be untoward ... after which how high shall we see price fly, as 'tis Gold we trust, not fairy dust!