Taking a deeper look at the massive $1T U.S. market opportunity for AVs
Who will be the next leader of the Federal Reserve? This past week we had conflicting news stories about the potential front-runner. But it seems we are now at the finalist stage, with Yellen and Taylor vying for the job. Each comes with methodological baggage.
Yellen is too wedded to economic models which have falsely predicted 2% inflation (although recent reports indicated she is growing more flexible in her approach). On the outside, Taylor, who loves to promote the Taylor Rule, appears far too rigid for an organization that operates on consensus. Equally important, he continues to compare the Great Recession to that of the early 1980s, despite radically different causations for each. But there is no denying this pair’s accomplishments, as they have each risen to the heights of their respective profession.
Over the last few weeks, there have been several stories about the yield curve’s flatness. Some bloggers have used this as click-bait, proclaiming “the sky is falling” or some such other nonsense. So, it seems like a good time to take a look at the credit market, starting with several indicators of financial market stress:
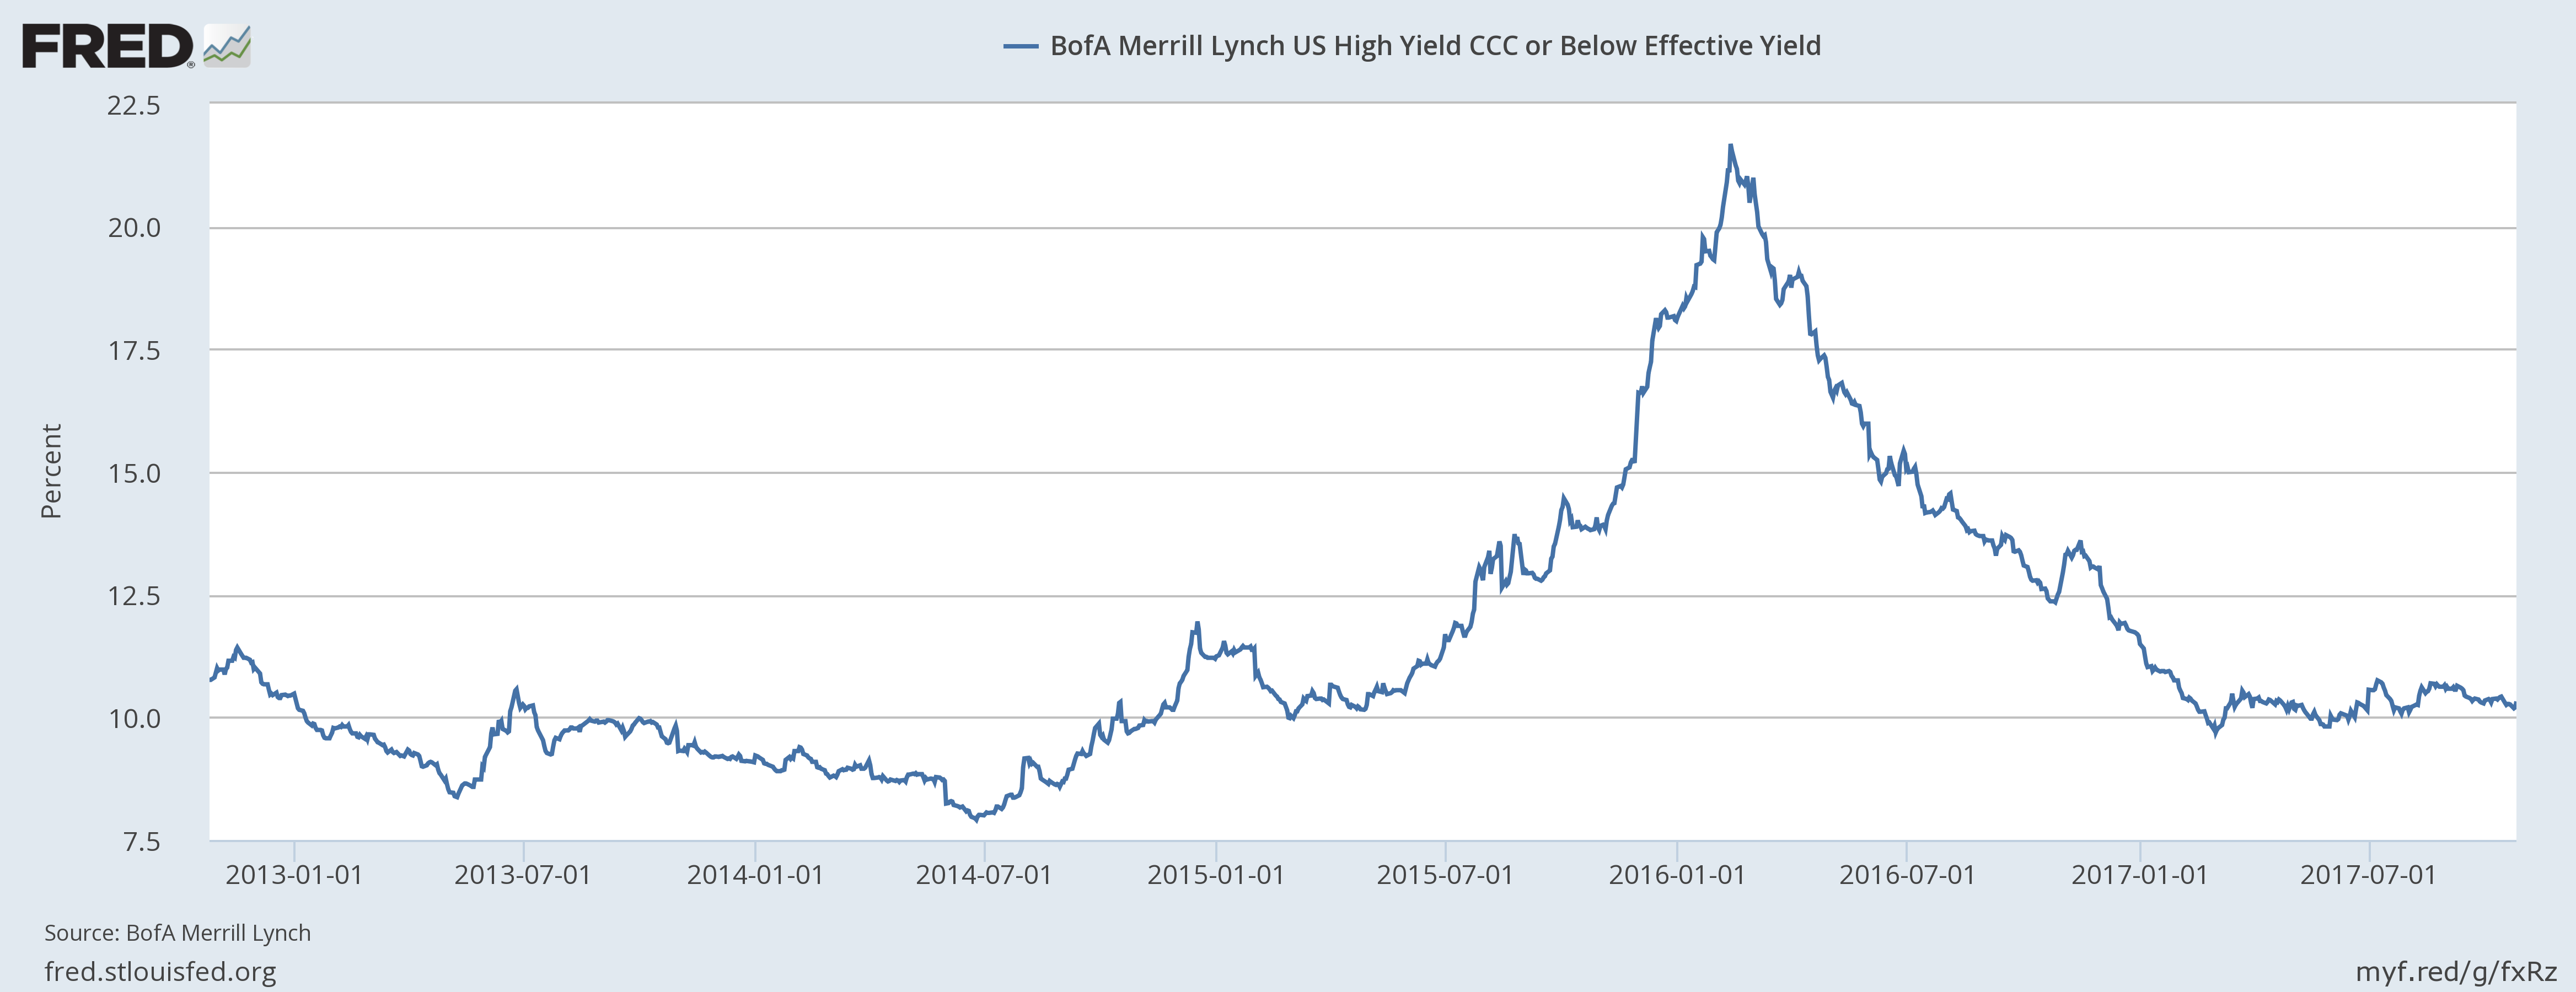
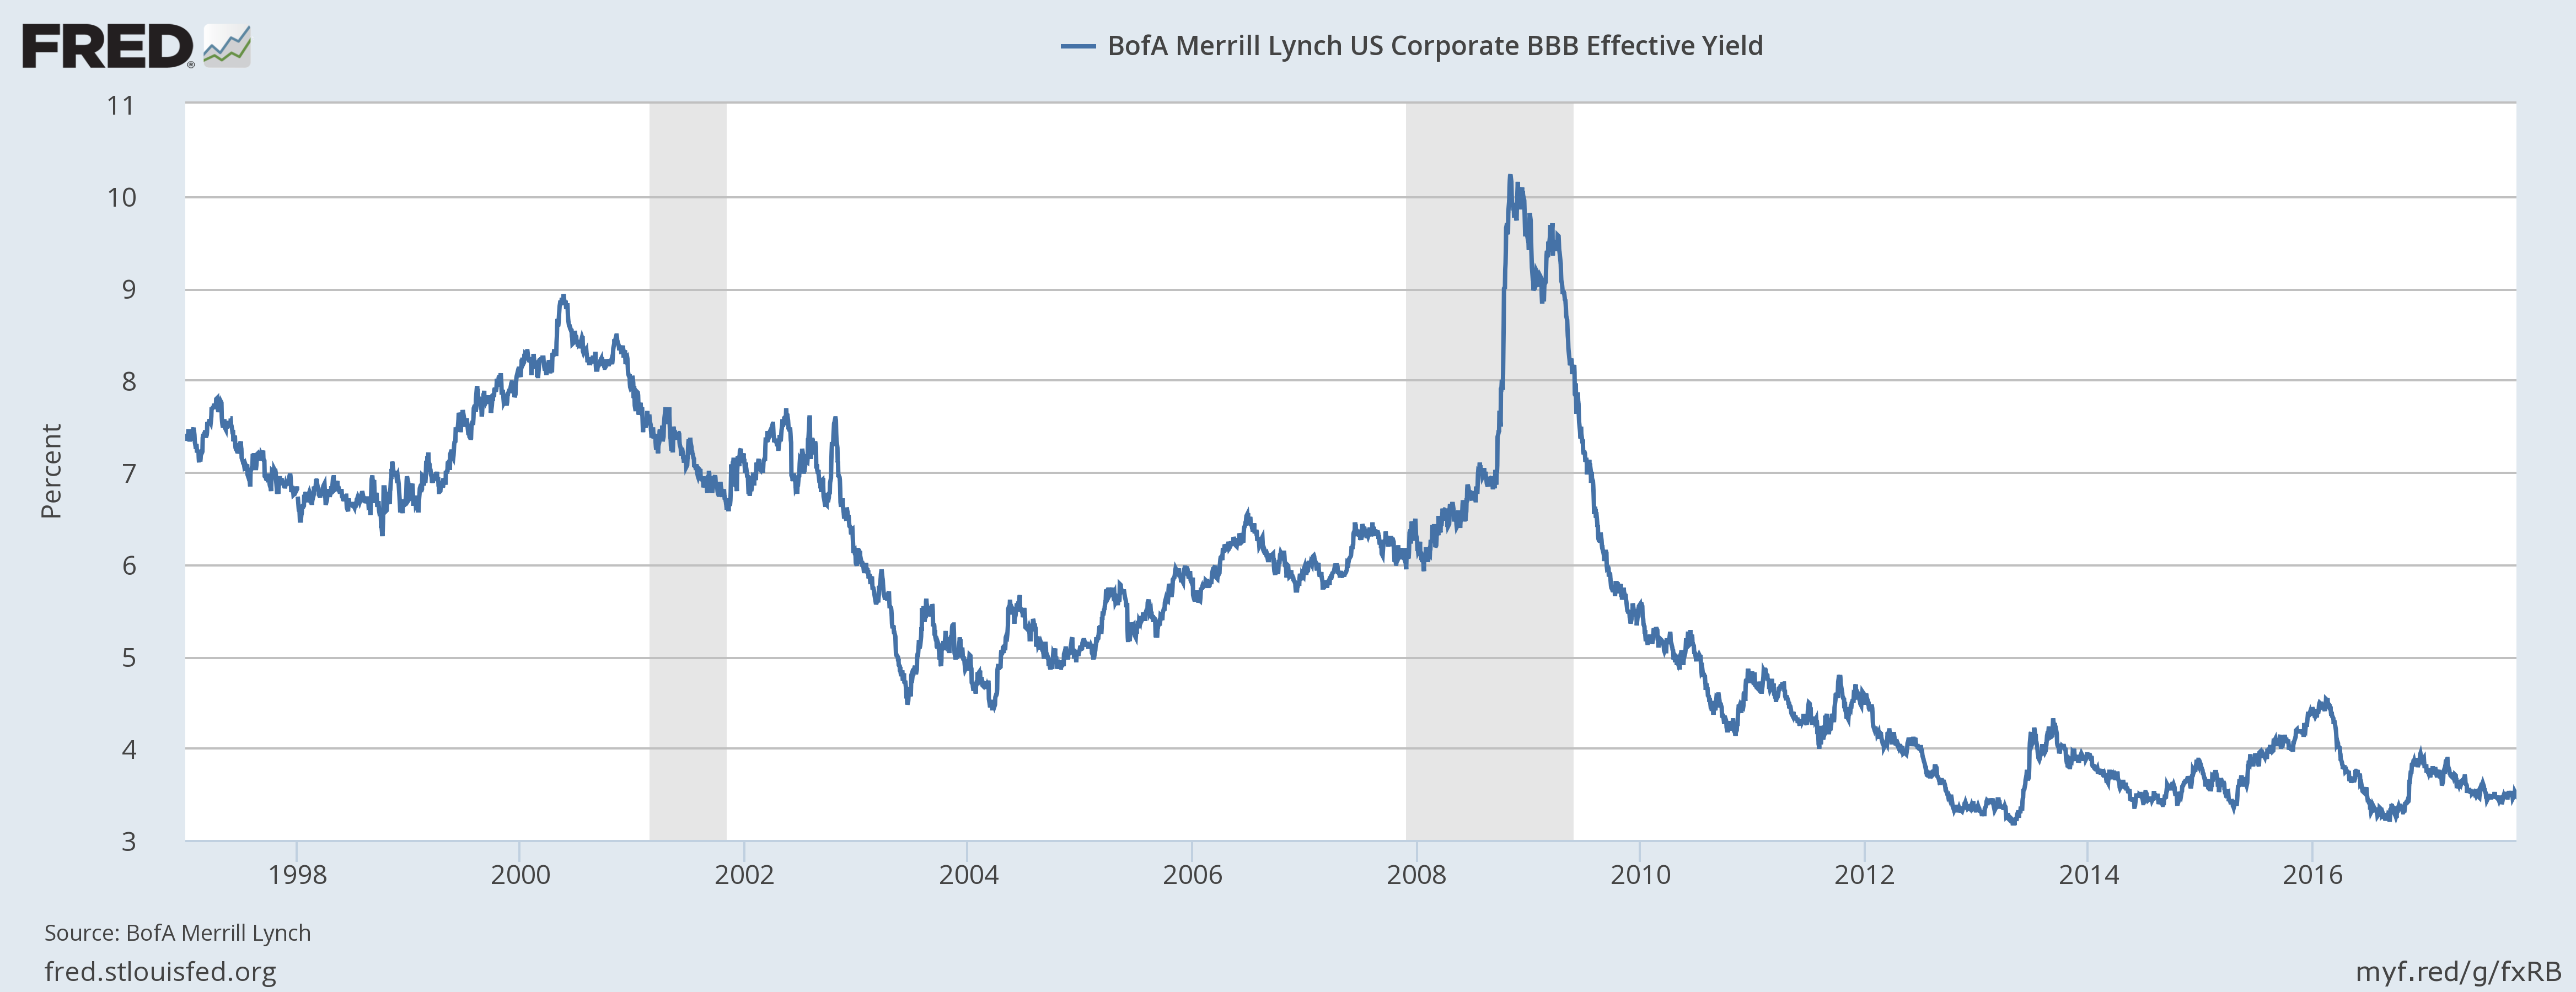
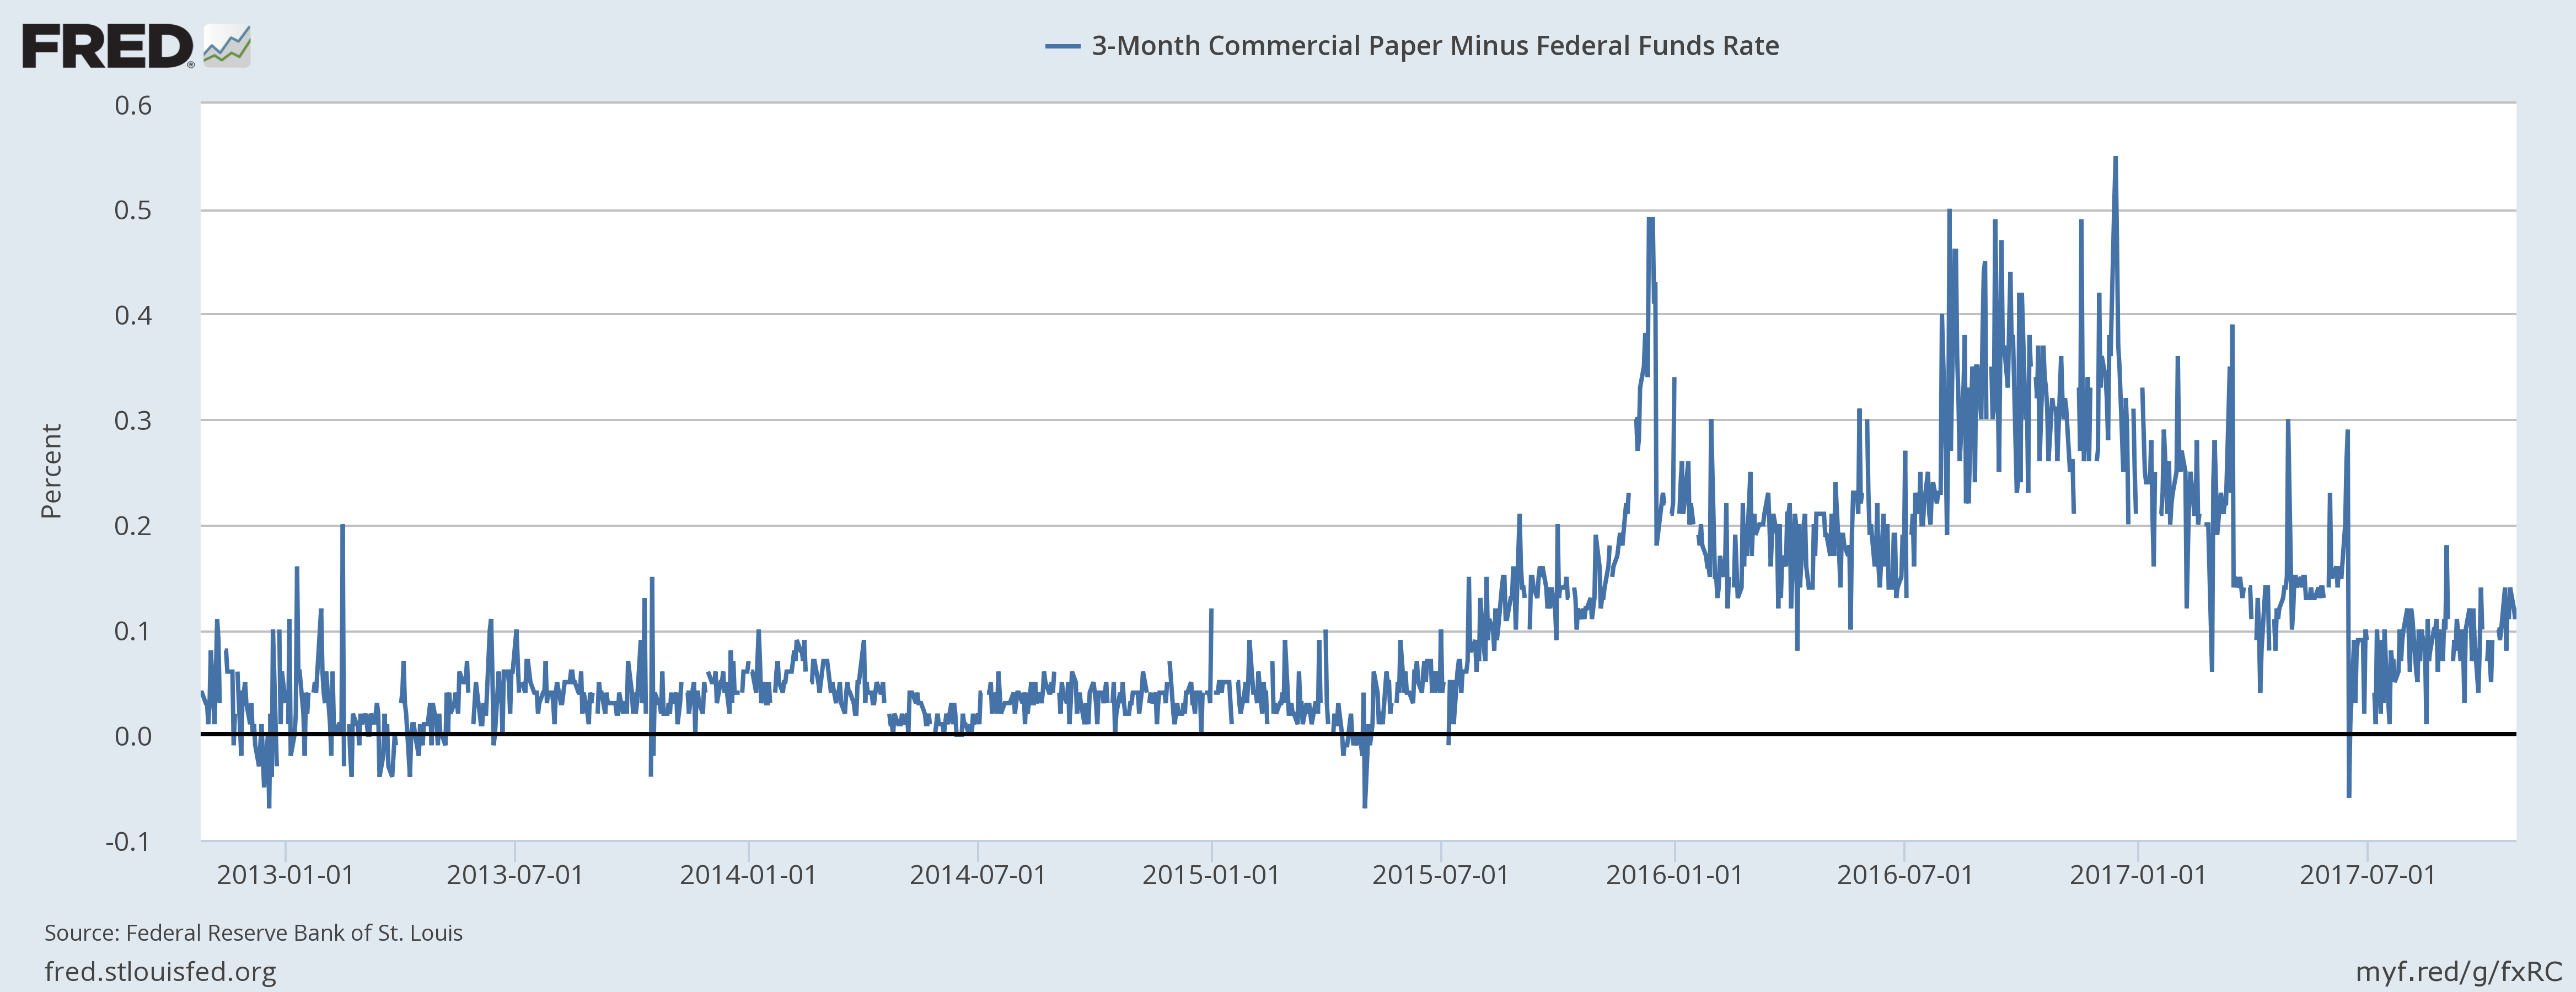
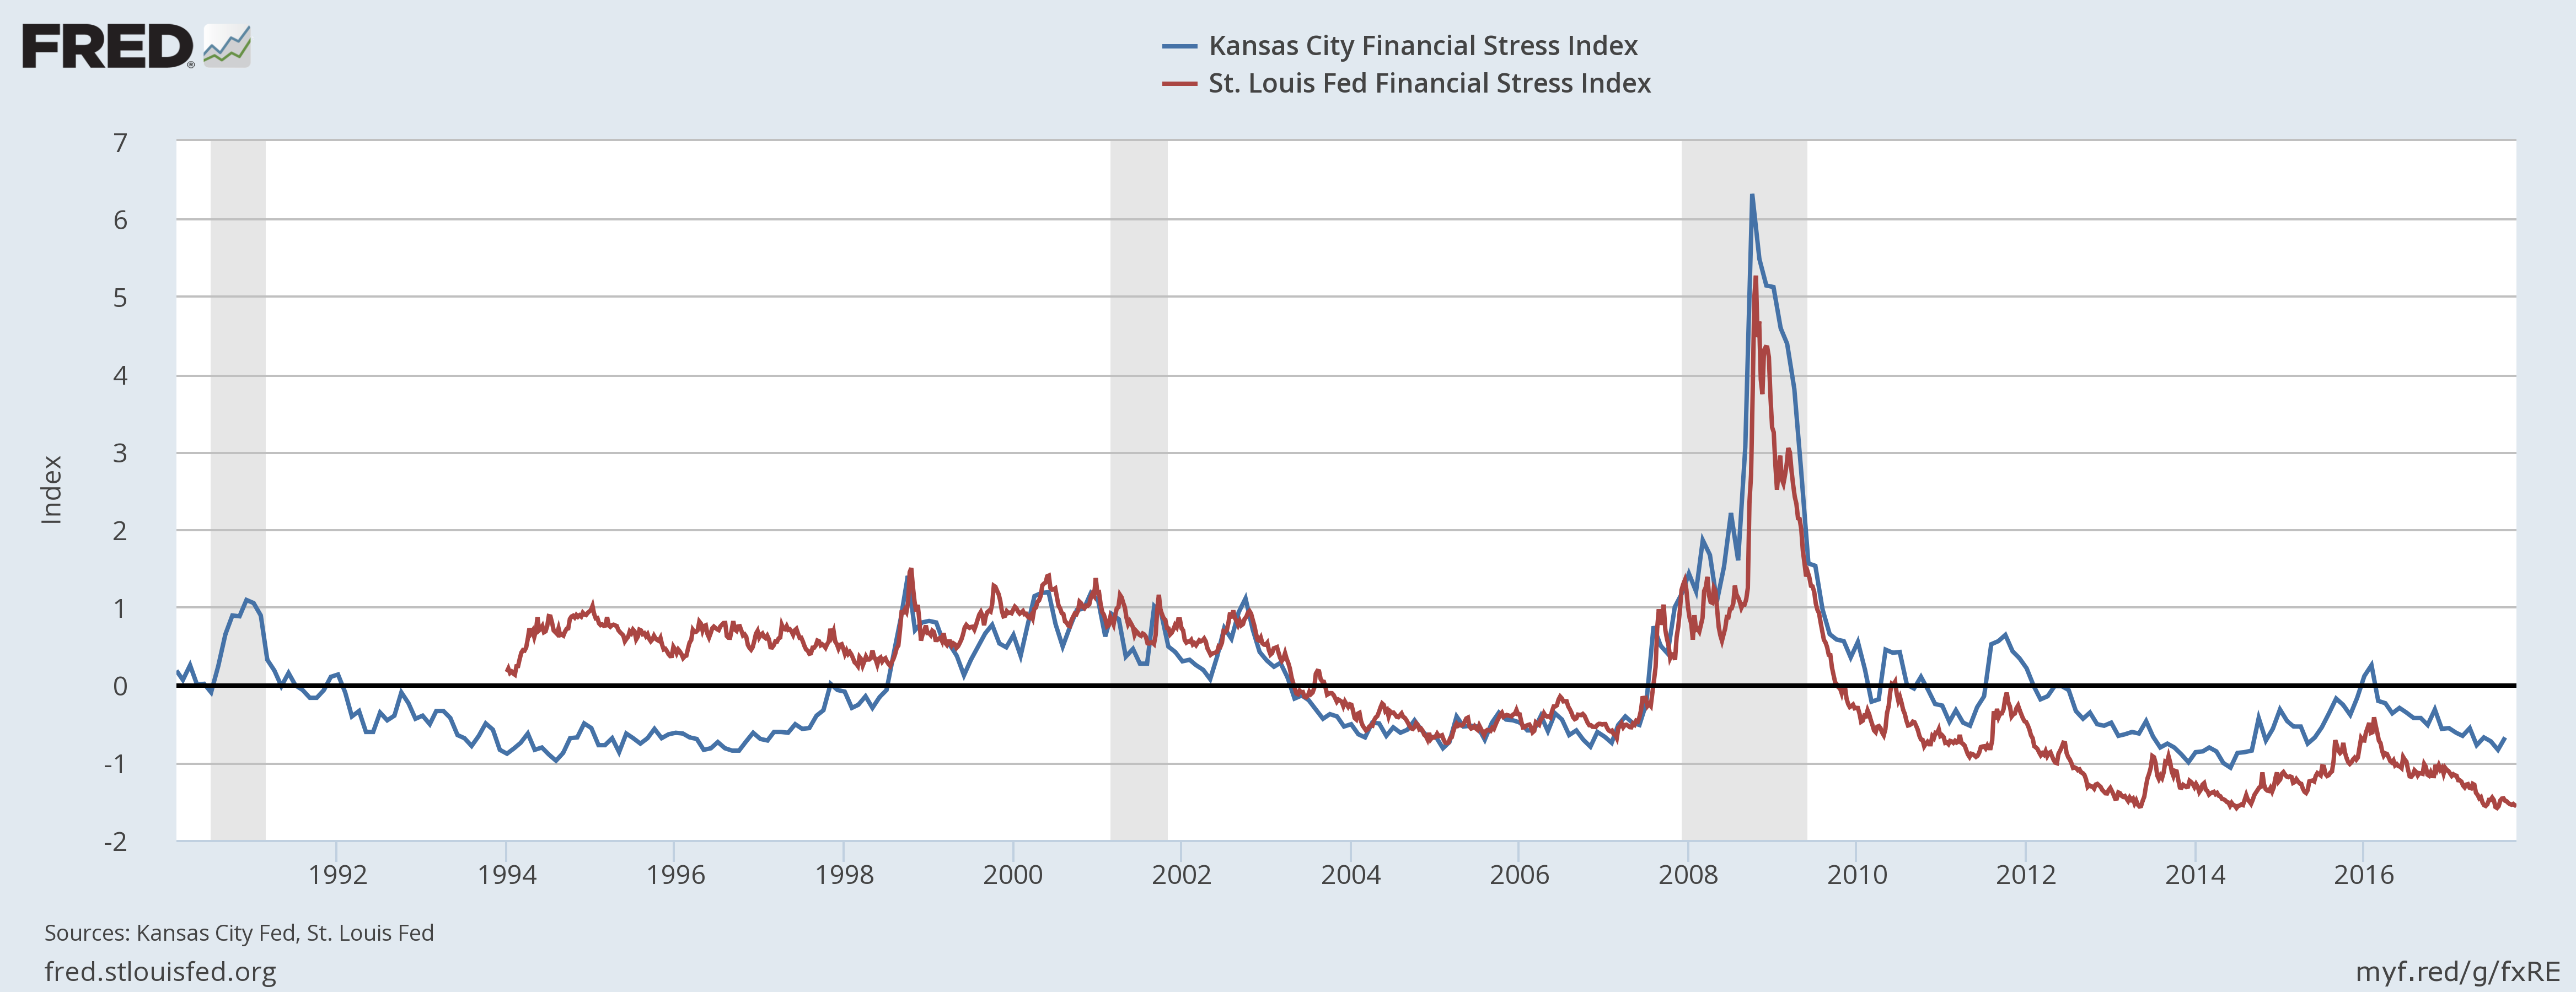
CCC yields (top chart) have been trading between 9.75 and 10.75 since early 2017. While this is a high level, it’s also a fair value for these lower-rated credits. BBBs (second from top) have traded between 2.2% and 4.5% since late 2012 – again, a fair level for these credits. Commercial paper minus federal funds (third from the top) is slightly elevated, but certainly not concerning. Finally, financial stress indicators (bottom chart) are at very low levels.
Let’s now turn to a few key interest rate spreads, starting with the 10-year / 3-month spread:
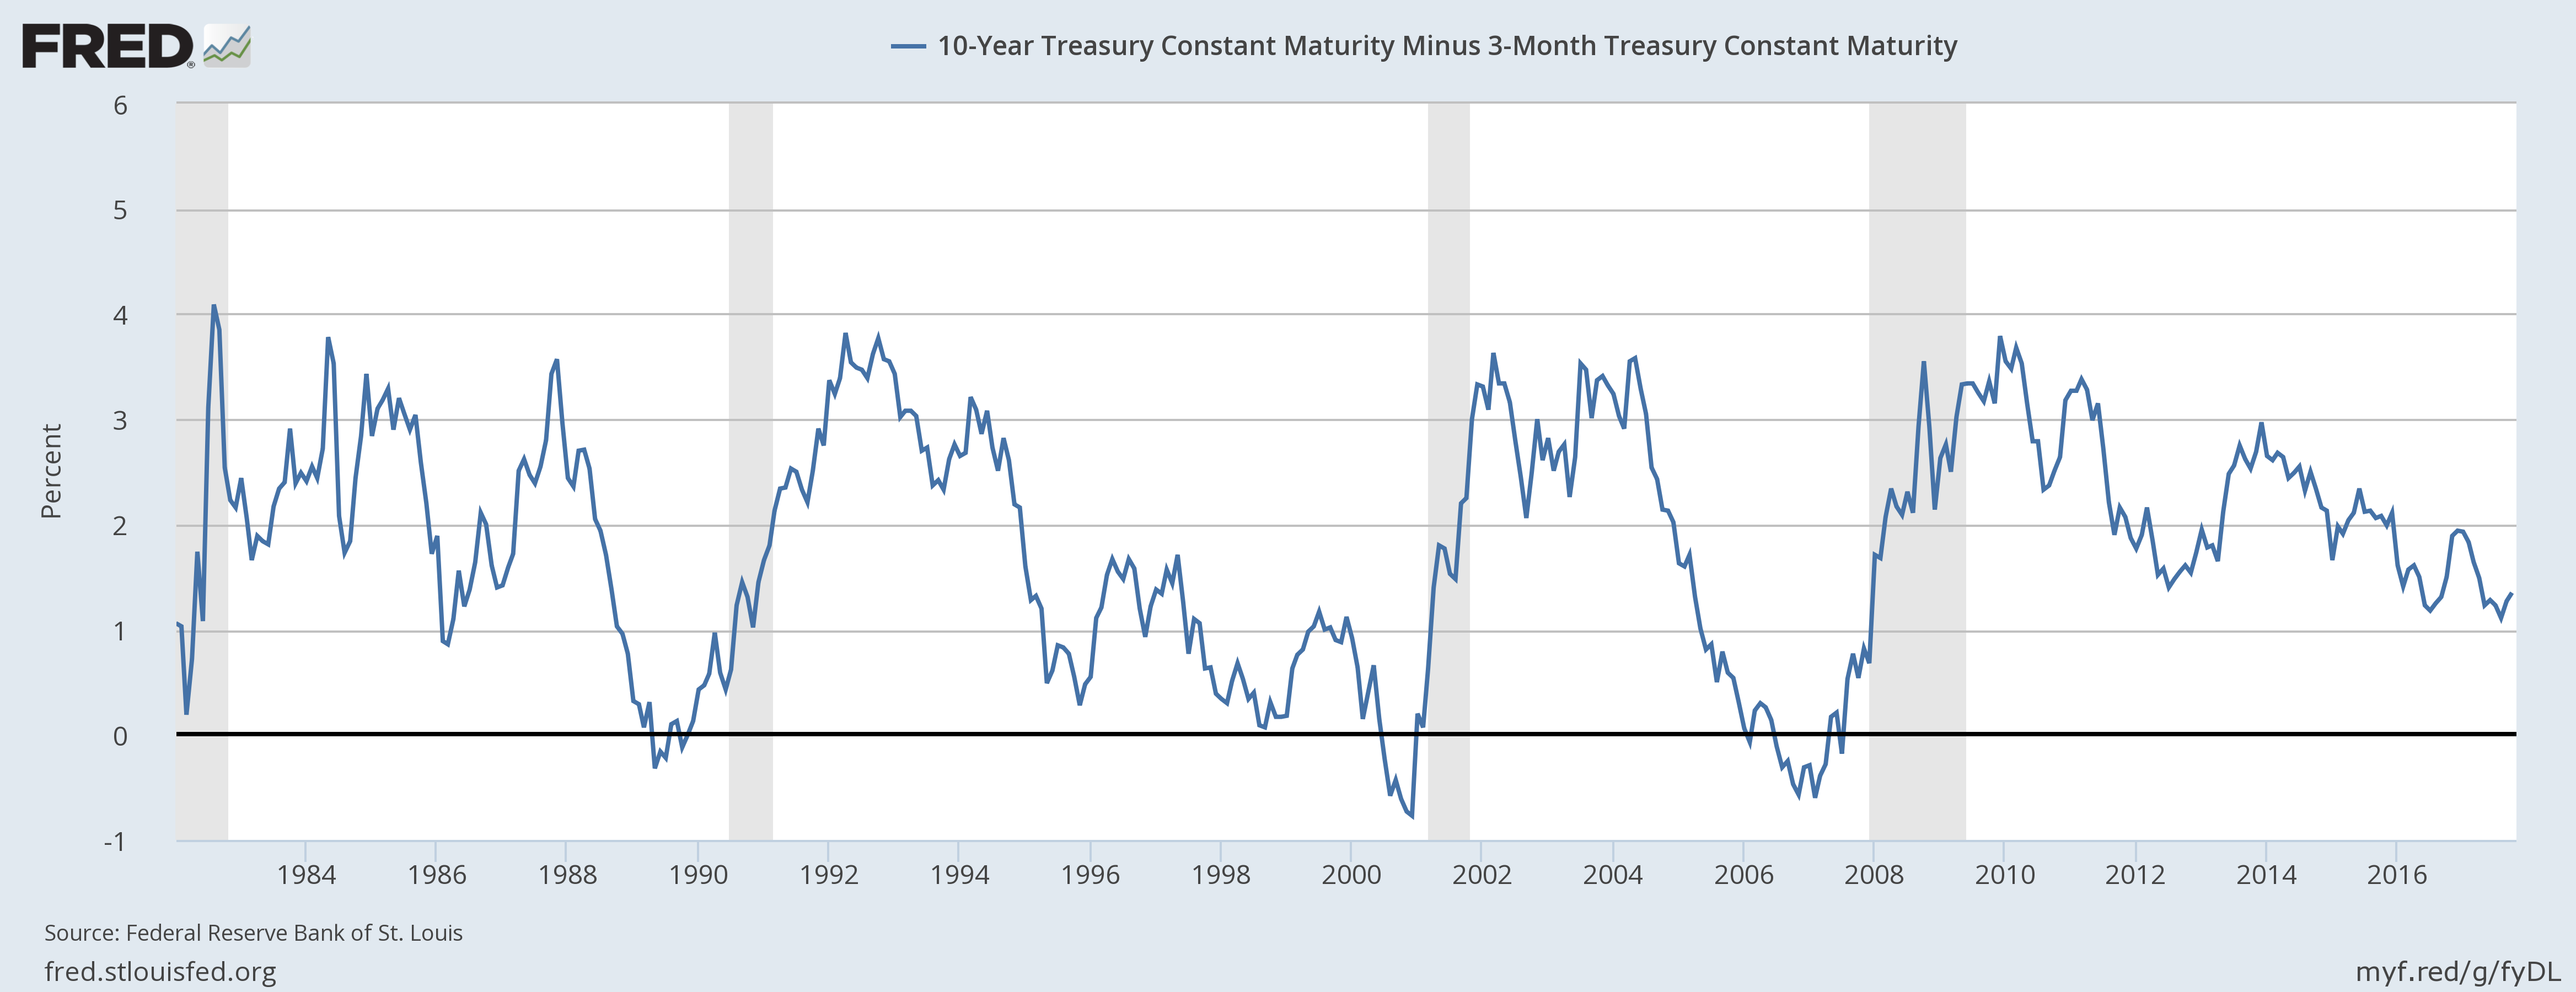
This spread usually turns negative between 12-24 months before a recession. Currently, the spread is over 120 basis points. The 10-year is selling in anticipation of a tax cut and hawkish Fed appointment, raising rates. Simply based on this curve, we’re about 2 years (this assumes the curve compresses continually for a year and then the recession follows 12 months later).
The 30-year / 3-month Treasury rate tells a similar story:
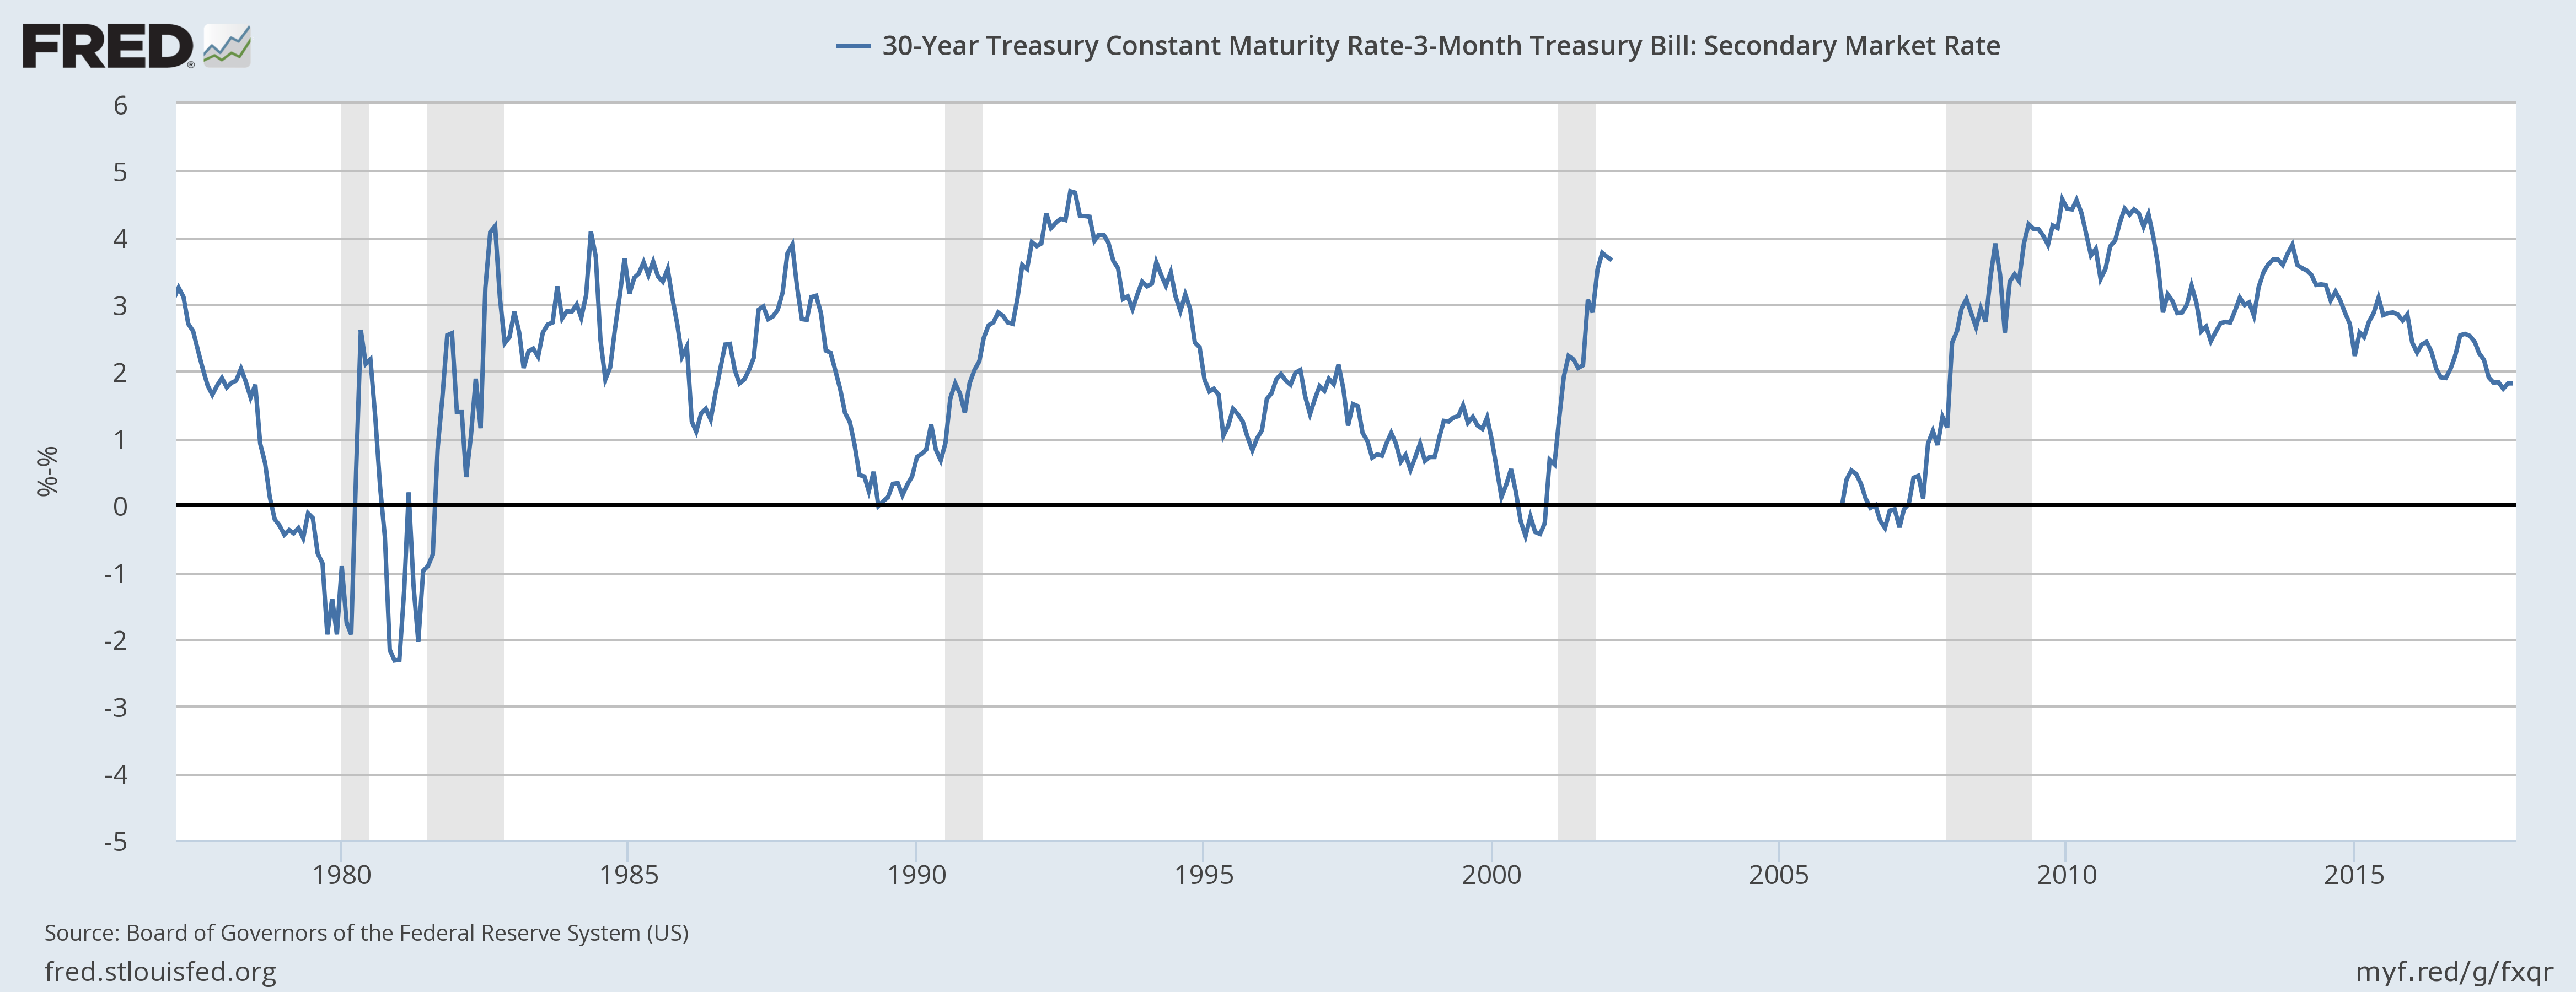
Currently, this spread is 180 basis points. Like the 10-year -- federal funds spreads, the 30-year-federal funds spread turns negative at least 12 months before a recession.
Put another way, if we were to just use the yield curve (which has a very good track record of predicting recession), the economy would be at least 24 months from a recession.
