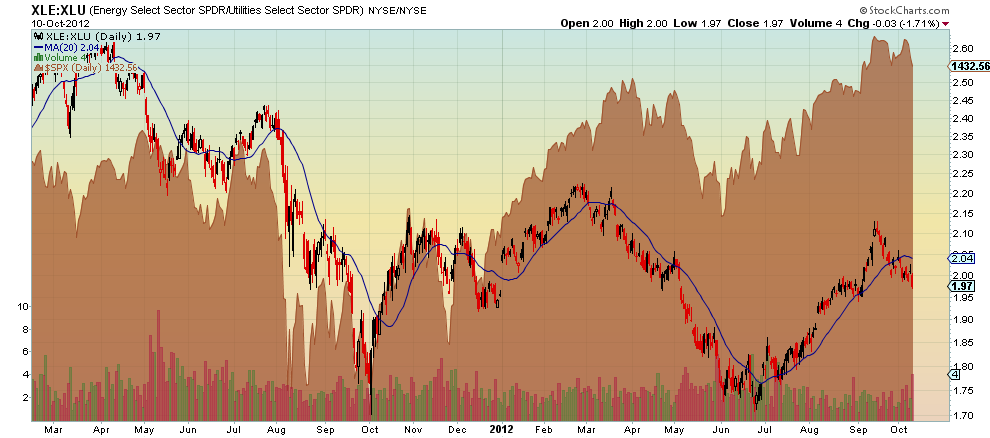
The first look at the relationship between the Energy Sector and the Utilities Sector in February of this year showed that it is a good proxy for the direction of the S&P 500. Updated to the present, the chart below shows the ratio of the Energy Select Sector SPDR (XLE) against the Utilities Select Sector SPDR (XLU).
The shaded area behind the ratio is the S&P 500 (SPX). The 20 day Simple Moving Average (SMA) was added as a signal line. Study this chart. What does it tell you? First it does confirm that the ratio of the Energy Sector to the Utilities Sector is a good proxy for the direction of the broad stock market. Logically this makes sense. If money is flowing from defensive Utilities into Energy it is a sign that the economy is heating up. 
Notice that the 20 day SMA has also played a role in confirming changes in direction of this ratio, and so too the market. Crosses in August and October 2011 and March and July 2012 confirmed a change in direction in the S&P. But in November and December 2011 there was a series of quick reversals that technically followed the rule but were much more muted responses.
The recent cross again in September fits the debate about a deep correction or a buyable dip, for now. keep your eye on the XLE/XLU ratio. A strong move lower would give more credence to a deeper correction while consolidation or a shallow angle that buyable dip case.
Disclaimer: The information in this blog post represents my own opinions and does not contain a recommendation for any particular security or investment. I or my affiliates may hold positions or other interests in securities mentioned in the Blog, please see my Disclaimer page for my full disclaimer.
Original post
- English (UK)
- English (India)
- English (Canada)
- English (Australia)
- English (South Africa)
- English (Philippines)
- English (Nigeria)
- Deutsch
- Español (España)
- Español (México)
- Français
- Italiano
- Nederlands
- Português (Portugal)
- Polski
- Português (Brasil)
- Русский
- Türkçe
- العربية
- Ελληνικά
- Svenska
- Suomi
- עברית
- 日本語
- 한국어
- 简体中文
- 繁體中文
- Bahasa Indonesia
- Bahasa Melayu
- ไทย
- Tiếng Việt
- हिंदी
No Need For A Crystal Ball, Just Look At Energy And Utilities
Published 10/11/2012, 08:01 AM
Updated 05/14/2017, 06:45 AM
No Need For A Crystal Ball, Just Look At Energy And Utilities
3rd party Ad. Not an offer or recommendation by Investing.com. See disclosure here or
remove ads
.
Latest comments
Install Our App
Risk Disclosure: Trading in financial instruments and/or cryptocurrencies involves high risks including the risk of losing some, or all, of your investment amount, and may not be suitable for all investors. Prices of cryptocurrencies are extremely volatile and may be affected by external factors such as financial, regulatory or political events. Trading on margin increases the financial risks.
Before deciding to trade in financial instrument or cryptocurrencies you should be fully informed of the risks and costs associated with trading the financial markets, carefully consider your investment objectives, level of experience, and risk appetite, and seek professional advice where needed.
Fusion Media would like to remind you that the data contained in this website is not necessarily real-time nor accurate. The data and prices on the website are not necessarily provided by any market or exchange, but may be provided by market makers, and so prices may not be accurate and may differ from the actual price at any given market, meaning prices are indicative and not appropriate for trading purposes. Fusion Media and any provider of the data contained in this website will not accept liability for any loss or damage as a result of your trading, or your reliance on the information contained within this website.
It is prohibited to use, store, reproduce, display, modify, transmit or distribute the data contained in this website without the explicit prior written permission of Fusion Media and/or the data provider. All intellectual property rights are reserved by the providers and/or the exchange providing the data contained in this website.
Fusion Media may be compensated by the advertisers that appear on the website, based on your interaction with the advertisements or advertisers.
© 2007-2024 - Fusion Media Limited. All Rights Reserved.
