Well, that is unexpected. Even though we’ve mentioned yesterday that a bullish US GDP and dovish FOMC statement will have the off chance to send Nikkei 225 higher, the manner in which Nikkei 225 has rallied today is certainly surprising. First off, price didn’t gap higher, but opened at where we left off yesterday, suggesting that market isn’t exactly extremely bullish about the happenings in US, which would have translated into a morning gap higher if traders were indeed bullish due to overnight events. Price traded consistently higher without any significant pullbacks during the day. Hence it is not unreasonable to say that today’s rally in Nikkei 225 is purely based on the efforts of Nikkei 225 bulls alone, unassisted by anybody else. And the efforts of the bulls did payoff significantly – with price clearing the 14,000 ceiling at literally the last second of trade before Tokyo Stock Exchange closed.
Hourly Chart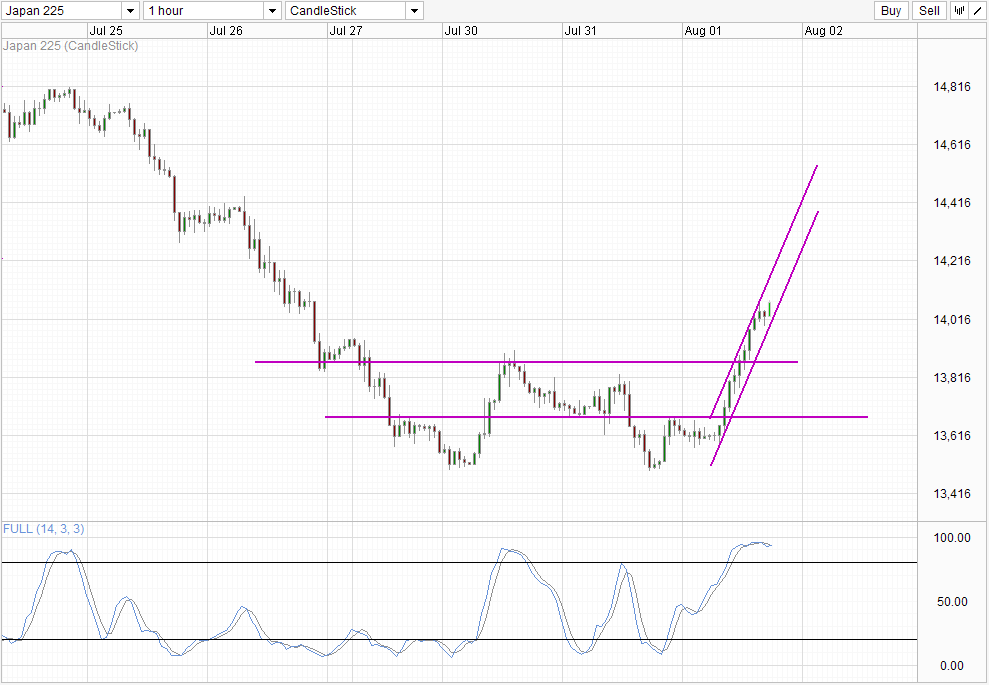
Why the bullishness?
There isn’t any apparent reason for today’s rally, with the only plausible explanation being technical bulls wanting to fight back strongly following yesterday’s disappointment. Another plausible explanation could be the fact that Future prices did not really dip below the lows of 30th July, hence encouraging adventurous bulls to enter. One thing led to another, and price eventually broke the previous swing high of Tuesday, allowing for further acceleration towards 14,000. The slightly better than expected Chinese Manufacturing PMI also helped bulls to push prices higher (even though the numbers are highly suspicious).
It is reasonable to be unconvinced by this explanation. But if that is the case, perhaps we could see price falling like a brick eventually especially given the broad bearish momentum seen from the hourly chart.
Monthly Chart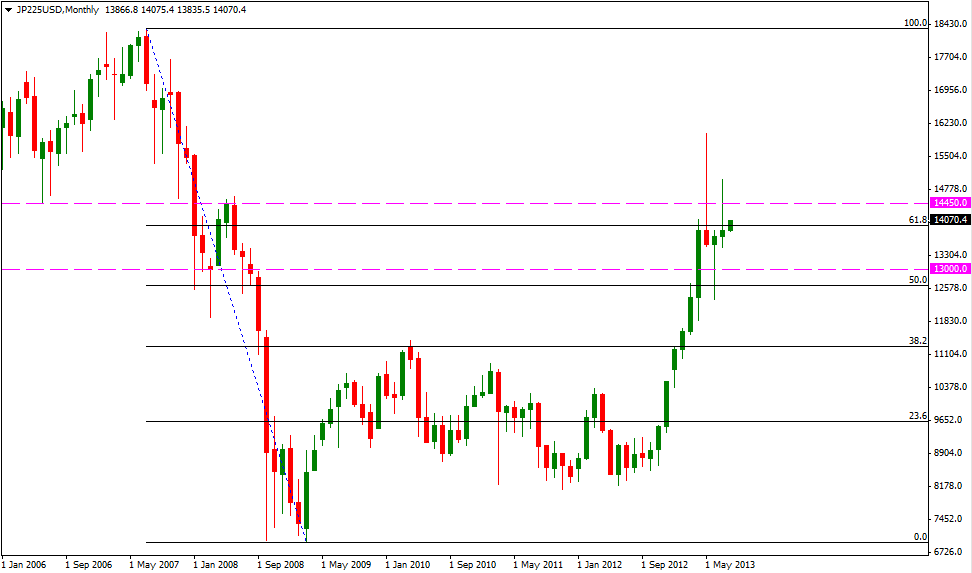
However, Monthly Chart is actually much more bullish. The July candle has since turned green despite yesterday’s loss, due to the candle time being based on US, and as such enjoying the early Asian morning gains (as it is technically still July in US when that happened). It is unlikely that the Japanese traders are looking at this chart for any technical significance, and as such we shouldn’t really be using this July green candle as an argument for why Nikkei 225 was so bullish today. Nonetheless, the technicals of this chart is still sound. With 2 consecutive bullish candle following the red inverted hammer, we are currently in a good position to continue the long-term bull trend that has started since November 2012. However, prices should ideally break above the 14,450 in August to show real bullish intent for the rest of 2013. Entering early may certainly be risky due to the fact that today’s rally remain unexplained adequately, coupled with the fact that past 3 months have seen long tailed candles, suggesting that we may be hoodwinked into a sense of security even when price move in our desired direction. Conservative traders may hence wish to hold their horses and wait for another month, or at least a few days and see if the bullish narrative plays out before committing heavily.
Original post
- English (UK)
- English (India)
- English (Canada)
- English (Australia)
- English (South Africa)
- English (Philippines)
- English (Nigeria)
- Deutsch
- Español (España)
- Español (México)
- Français
- Italiano
- Nederlands
- Português (Portugal)
- Polski
- Português (Brasil)
- Русский
- Türkçe
- العربية
- Ελληνικά
- Svenska
- Suomi
- עברית
- 日本語
- 한국어
- 简体中文
- 繁體中文
- Bahasa Indonesia
- Bahasa Melayu
- ไทย
- Tiếng Việt
- हिंदी
Nikkei 225: Surprise Rally Today
Published 08/01/2013, 06:39 AM
Updated 07/09/2023, 06:31 AM
Nikkei 225: Surprise Rally Today
3rd party Ad. Not an offer or recommendation by Investing.com. See disclosure here or
remove ads
.
Latest comments
Install Our App
Risk Disclosure: Trading in financial instruments and/or cryptocurrencies involves high risks including the risk of losing some, or all, of your investment amount, and may not be suitable for all investors. Prices of cryptocurrencies are extremely volatile and may be affected by external factors such as financial, regulatory or political events. Trading on margin increases the financial risks.
Before deciding to trade in financial instrument or cryptocurrencies you should be fully informed of the risks and costs associated with trading the financial markets, carefully consider your investment objectives, level of experience, and risk appetite, and seek professional advice where needed.
Fusion Media would like to remind you that the data contained in this website is not necessarily real-time nor accurate. The data and prices on the website are not necessarily provided by any market or exchange, but may be provided by market makers, and so prices may not be accurate and may differ from the actual price at any given market, meaning prices are indicative and not appropriate for trading purposes. Fusion Media and any provider of the data contained in this website will not accept liability for any loss or damage as a result of your trading, or your reliance on the information contained within this website.
It is prohibited to use, store, reproduce, display, modify, transmit or distribute the data contained in this website without the explicit prior written permission of Fusion Media and/or the data provider. All intellectual property rights are reserved by the providers and/or the exchange providing the data contained in this website.
Fusion Media may be compensated by the advertisers that appear on the website, based on your interaction with the advertisements or advertisers.
© 2007-2024 - Fusion Media Limited. All Rights Reserved.