
The markets have been eagerly awaiting the 1st NFP of the year. Whatever the outcome, today's article intends to look at a few numbers and study last month's price action, to help you quantify the release when it comes out to better prepare you for any subsequent moves.
JAN NFP: 194k CONSENSUS
The automatic trendline (yellow) highlights how the actual result is within an uptrend, making negative results increasingly more unlikely. Additionally the past 4 releases have either been above or on the 3 month average to further highlight increase in momentum on job creation.
- All actual since 2010 have been positive
- 2 of these have been above 240k
- The majority of releases being under 200k
- Over the past 12-months only 2 releases have come in less than the 3-month average.
- The previous 12-month period saw 5 of the releases beneath its own 3-month average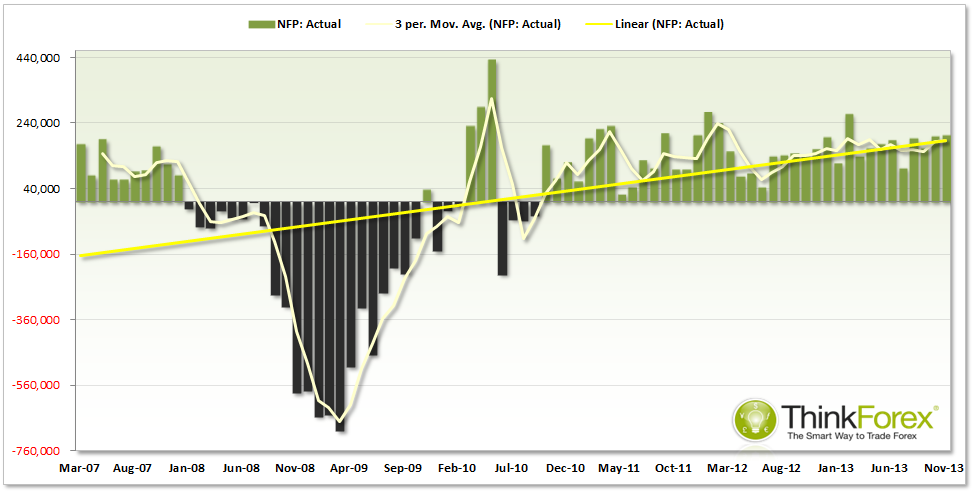
THE DIFFERENTIAL
The chart below shows Actual (green) with Consensus overlaid (blue). This is to highlight how often the 2 numbers disagree, but as traders this is what we want to see as it is the deviation away from the consensus that really moves markets, regardless of the direction (+ or - from consensus). The larger deviation away from the consensus, the larger the subsequent moves we can expect from the markets. 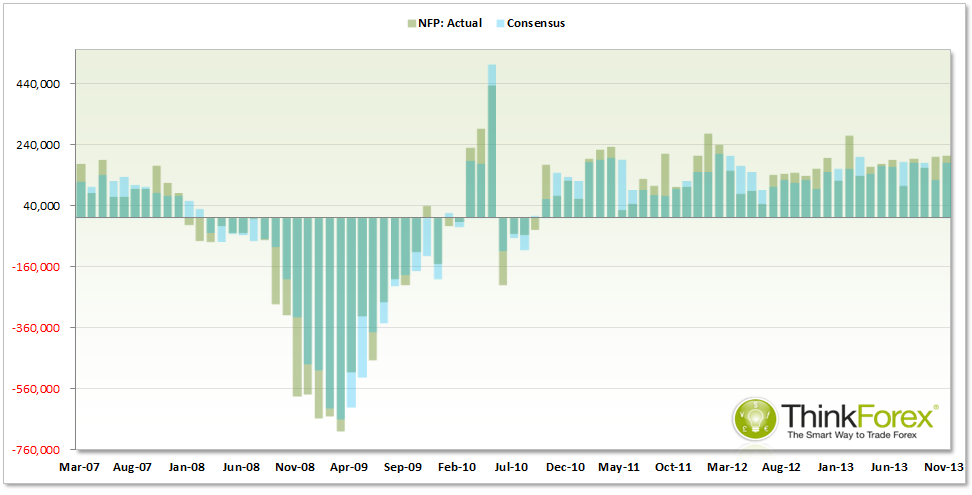
ACTUAL vs CONSENSUS: FREQUENCY
To make this easier to visualise I have plotted the graph as the difference between the two. A positive reading means we beat the consensus, whilst a negative reading means the NFP came in less than expected.
Since March 2007, over 82 NFP releases:
- The majority of the data comes in less than 80k
- Only 6 releases are between 80-130k
- Only 2 above 130k since
- October's release was the largest differential in 8 months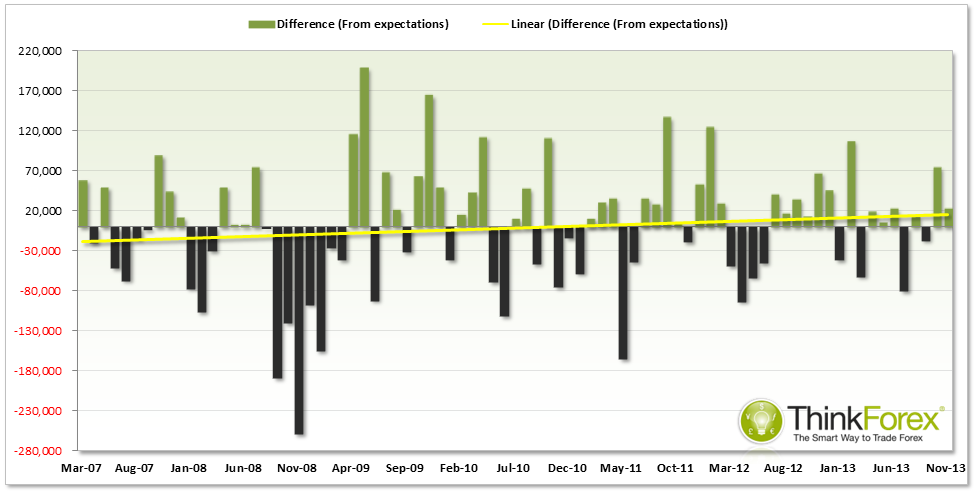
FREQUENCY DISTIBUTION: Actual vs Consensus
Taking this a step further I have created a frequency chart to better quantify the likelihood of a shock announcement. This helps us quantify (approximately) the likelihood of a major differential from the consensus and create realistic expectations.
Interestingly, over the past 17 months, 13 releases have come in above expectations (76.4%) to highlight the pessimism of US job creation - whilst US Equities continued to trade to record highs fuelled by the Asset Purchase program.
Whilst I admit this is not the most comprehensive way of calculating probabilities, it serves simply to provide us with a simple benchmark leading up to the release.
The data below uses the past 80 data points from NFP and is correct up until November 2013. The idea is to quantify typical deviations away from consensus and roughly estimate 'surprise' numbers to watch out for, in hope of capitalising on a larger subsequent market move.
NFP Above Expectations
+20k = 15%
+60k = 12.5%
+40k = 10%
Below Expectations
- 40k = 11.25%
- 60k = 7.5%
- 80k = 5%
Between
-20k to +20k = 38.75%
-40k to +40k = 48.75% 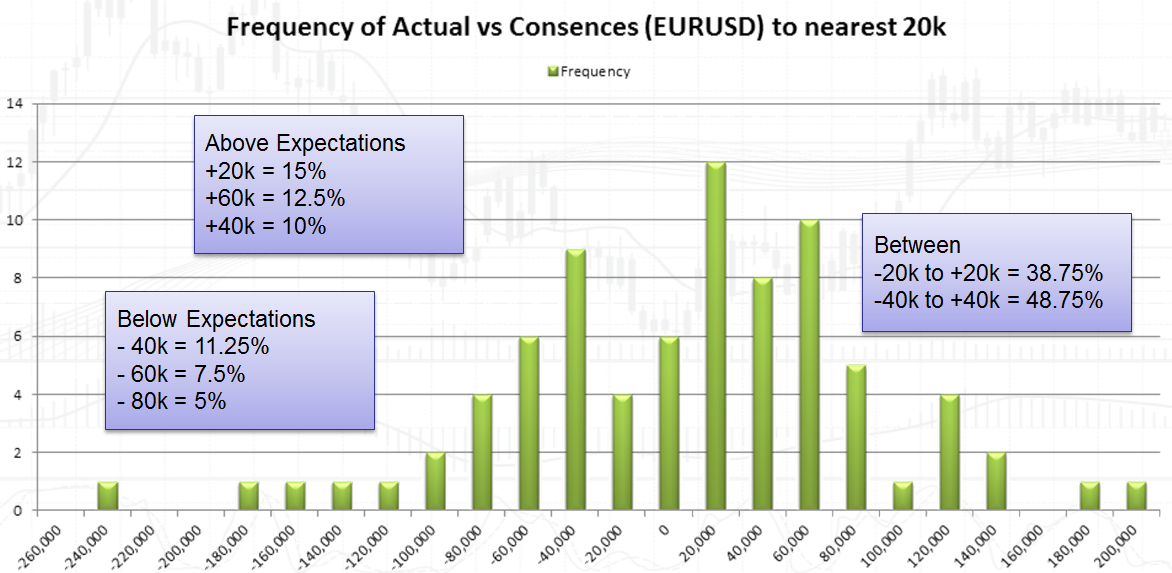
SUMMARY:
- A higher-than-expected NFP tends to be bullish for USD
- A lower-than-expected NFP tends to be bearish for USD
- I suspect we'd need to see differences of +/- 50k-60k from the consensus before we can expect more substantial moves.
- If we see numbers within the +/- 20k-40k range then I would expect more choppy and indecisive price action at, and just after the release before typical trends went on their usual route.
DISCLAIMER: Trading in the Foreign Exchange market involves a significant and substantial risk of loss and may not be suitable for everyone. You should carefully consider whether trading is suitable for you in light of your age, income, personal circumstances, trading knowledge, and financial resources. Only true discretionary income should be used for trading in the Foreign Exchange market. Any opinion, market analysis or other information of any kind contained in this email is subject to change at any time. Nothing in this email should be construed as a solicitation to trade in the Foreign Exchange market.
If you are considering trading in the Foreign Exchange market before you trade make sure you understand how the spot market operates, how Think Forex is compensated, understand the Think Forex trading contract, rules and be thoroughly familiar with the operation of and the limitations of the platform on which you are going to trade. A Financial Services Guide ( FSG) and Product Disclosure Statements (PDS) for these products is available from TF GLOBAL MARKETS (AUST) PTY LTD by emailing compliance@thinkforex.com.au .The FSG and PDS should be considered before deciding to enter into any Derivative transactions with TF GLOBAL MARKETS (AUST) PTY LTD. Please ensure that you fully understand the risks involved, and seek independent advice if necessary. Also, see the section titled “Significant Risks” in our Product Disclosure Statement, which also includes risks associated with the use of third parties and software plugins. The information on the site is not directed at residents in any country or jurisdiction where such distribution or use would be contrary to local law or regulation. 2013 TF GLOBAL MARKETS (AUST) PTY LTD. All rights reserved. AFSL 424700. ABN 69 158 361 561. Please note: We do not service US entities or residents.
- English (UK)
- English (India)
- English (Canada)
- English (Australia)
- English (South Africa)
- English (Philippines)
- English (Nigeria)
- Deutsch
- Español (España)
- Español (México)
- Français
- Italiano
- Nederlands
- Português (Portugal)
- Polski
- Português (Brasil)
- Русский
- Türkçe
- العربية
- Ελληνικά
- Svenska
- Suomi
- עברית
- 日本語
- 한국어
- 简体中文
- 繁體中文
- Bahasa Indonesia
- Bahasa Melayu
- ไทย
- Tiếng Việt
- हिंदी
NFP Friday: Your Visual Guide
Published 01/10/2014, 05:49 AM
Updated 07/09/2023, 06:31 AM
NFP Friday: Your Visual Guide
3rd party Ad. Not an offer or recommendation by Investing.com. See disclosure here or
remove ads
.
Latest comments
Install Our App
Risk Disclosure: Trading in financial instruments and/or cryptocurrencies involves high risks including the risk of losing some, or all, of your investment amount, and may not be suitable for all investors. Prices of cryptocurrencies are extremely volatile and may be affected by external factors such as financial, regulatory or political events. Trading on margin increases the financial risks.
Before deciding to trade in financial instrument or cryptocurrencies you should be fully informed of the risks and costs associated with trading the financial markets, carefully consider your investment objectives, level of experience, and risk appetite, and seek professional advice where needed.
Fusion Media would like to remind you that the data contained in this website is not necessarily real-time nor accurate. The data and prices on the website are not necessarily provided by any market or exchange, but may be provided by market makers, and so prices may not be accurate and may differ from the actual price at any given market, meaning prices are indicative and not appropriate for trading purposes. Fusion Media and any provider of the data contained in this website will not accept liability for any loss or damage as a result of your trading, or your reliance on the information contained within this website.
It is prohibited to use, store, reproduce, display, modify, transmit or distribute the data contained in this website without the explicit prior written permission of Fusion Media and/or the data provider. All intellectual property rights are reserved by the providers and/or the exchange providing the data contained in this website.
Fusion Media may be compensated by the advertisers that appear on the website, based on your interaction with the advertisements or advertisers.
© 2007-2024 - Fusion Media Limited. All Rights Reserved.