
I have been testing a new trading system that I came up with while I was reading Suri Duddella’s book, Trade Chart Patterns like the Pros. This particular idea came across my mind during the first chart patterns that Suri describes how he trades in his trading book. First I noticed that he enters the market on the very next day after the pattern is complete and only if the price trades in the same direction. Then I began comparing the day’s close with last three days’ high or low, since he often mentions in the first pages how this specific chart pattern has provided positive signals. In the last weeks there have been numerous bullish and bearish signals that look quite promising according to the rules above. I’m testing this trading system on stocks and forex but I suppose it can also be applied to any other instrument.
Rules of the trading system
There are two basic rules to trade long:
- Close (C) must be higher than the highest high of the last 3 days.
- The signal is confirmed on the next trading day if the price trades above the high of the previous day.
Similarly, there are also two basic rules to sell short:
- Close (C) must be lower than the lowest low of the last 3 days.
- The signal is confirmed on the next trading day if the price trades below the low of the previous day.
A stop loss order is recommended of course and in the case of long trades, we should usually set it below the most recent low. Respectively, the stop loss order for short trades should be set above the most recent high. Additionally, the trading system performance can be further improved by combining the rules above with other elements of technical analysis, like support and resistance levels, Fibonacci retracements, ascending and descending triangles or other formations.
Example In stock trading (Google)
The first long trade could have been initiated in June (A). After a retracement that lasted five days, a long green candlestick closed higher than the last three days’ high. On the very next day Google shares began trading close to the last day’s high. The system would instruct us to trade long as soon as Google stock traded higher than that high at about $570. The stop loss would be set at $550, although it would never be hit. According to your personal management of the trade, returns could have reached 35% if you held your position until GOOG hit $770. 
Another profitable long trade could have happened in November (C). The gaining candlestick with an open gap right after the doji candlestick indicated an uptrend resume. Google stock traded above $670 (previous high) on the next day alerting traders to go long, although shares closed at the opening price. Still the uptrend has been confirmed and long positions have been favored in the last two months.
Obviously the system cannot make 100% correct predictions, far from it! That is why we would lose money if we traded long in late October (B). The green candlestick printed a close higher than the previous days’ high and GOOG stock printed new highs on the next day, but eventually shares collapsed below the support level of $670 in the following days. Hopefully a stop loss would minimize the losses.
(D) is a sell-short signal but I wouldn’t recommend following that signal. The frightening falling candlestick that shows a $100 decline of Google share price surely went south of the previous lows, but it also disallowed of a fruitful reward-risk trade. In order to trade short at $670 using a 2-to-1 reward-risk ratio, one should set a profit target at $460, having previously set a stop loss at $760! Good luck predicting a retracement back to the 2010 low!
Example In Forex (EUR/USD)
According to the rules of the trading system, a forex trader could have bought Euros in July (A) at 1.2340 when the currency pair printed new high following the long green candlestick. This kind of trading should be considered as long-term trading, given the fact that the stop loss would have been set 300 pips lower at 1.2040, leading to a similar profit target at least. EUR/USD did climb up to 1.3150 in September for about 800 pips profit.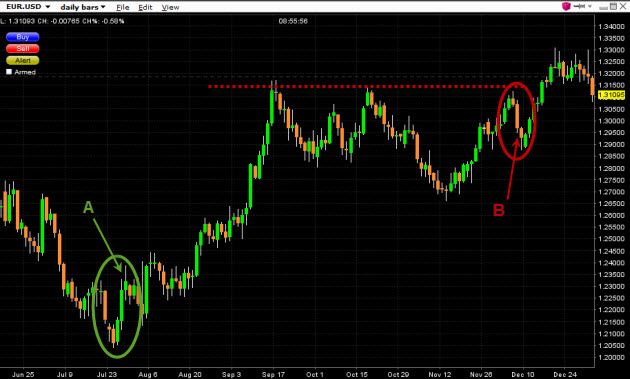 EUR/USD" title="eurusd-stock-chart-daily" width="600" height="575">
A short trade signal is noted at (B). As Euro seemed unable to penetrate the resistance level at 1.3150, the third confirmation of that specific level added more value to the signal. Unfortunately for those who trusted the U.S. dollar, Euro didn’t go much lower before managing to print new highs at 1.33 in the year’s end!
That was an introduction to a trading system that is still work in progress. I can’t yet comment on investing facts like ROI regarding the system, as no backtesting has been done. Hopefully I will have more news to share in future posts.