Summary: When will the next recession arrive? Economists, like most professionals, sell certainty. They assure us that data has meaning and can be understood. Sadly that’s reliably true only during trends, so economists usually miss inflection points. But a new era began ~2000, bringing new dynamics and normals, making the search for inflection points especially difficult. Embrace the mystery, since we have more questions than answers!
This expansion has run for 68 months, the 5th longest of the 11 recessions since WWII (average length of 58 months (from NBER). It’s time to start our recession watch.
More ugly data
Much of the data is confusing, with alternating good and bad news (see the posts at the end for previous chapters). Optimists obsess about the strong jobs number, but that’s only one metric, and a coincident indicator (unemployment claims is a leading indicator, and flat).
Today we look at a darker dot: wholesale sales for January, down 3.1% MoM SA. Despite the easy excuse of it’s just oil, the decline affected both durable and non-durable goods (broader than the slowing in December). The December drop in durable goods MoM SA was the 3rd largest since the recession (behind Feb & May 2011).
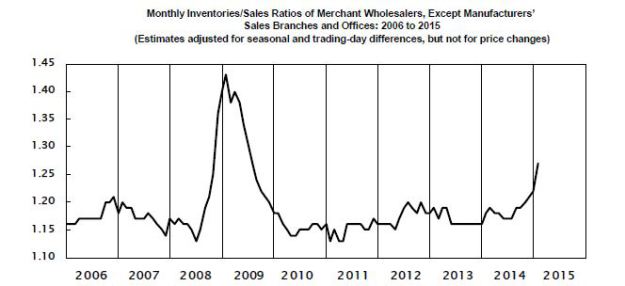
As usual with these unexpected downturns, inventories accumulate. See the ugly chart below of the inventory/sales ratio, showing the kind of numbers that excite CFOs (cut production! push sales!). Petroleum is not driving that rise: its i/s ratio is up 25% YoY, but it is only 3% of total inventories and 10% of sales. But this is January data (February was probably worse), and the i/s ratio is a lagging indicator.

Prices might tell us something.
I don’t share the avant garde fetish for market signals, since they’re so often noise when they’re not mysterious. But they’ve got to be watched.
Watching stock prices has been a waste of time for years as they move with the Fed’s monetary magic, and that’s been “on” since the depths of the recession. Someday they will again become useful. We watch stock prices hoping to see that day before events run over us (much as Wile E. Coyote peers into the dark railroad tunnel into which the Road Runner just escaped).
Interest rates should be one of our best guides, but they’re hopelessly distorted by the machinations of the world’s major central banks. Even credit spreads tell us little but that CB’s zero interest rate policies (ZIRP) — for some CB’s, now a negative rates policy — have forced even risk-adverse investors into the deep end of the pool.
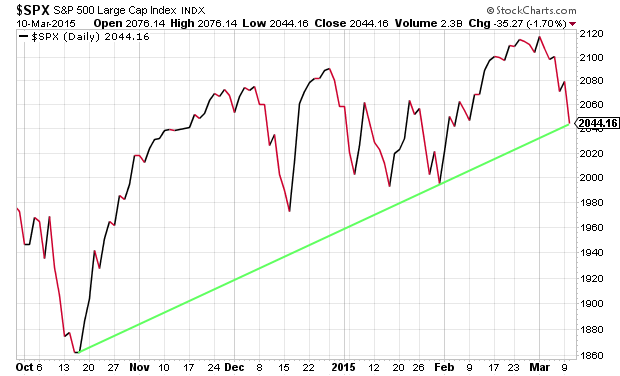
But we’ll always have stock prices. The S&P 500 index has returned to the floor of its trend (“support”, if you believe such terms have meaning). No news here, but watch for a break through the green line! US stocks have had the 3rd greatest 6-year run since 1900, behind only the periods ending in 1929 and 1999. That doesn’t mean this will end badly, but suggests keeping our eyes open.

From StockCharts.com, posted with permission.
Other prices are similarly opaque in meaning. The global trade numbers look strong (through December, at least), but the Baltic Dry Index is weak. It shows the cost of moving bulk cargo by ship (e.g., coal, iron ore). On February 18 it was 509, the lowest since the record began in 1985.
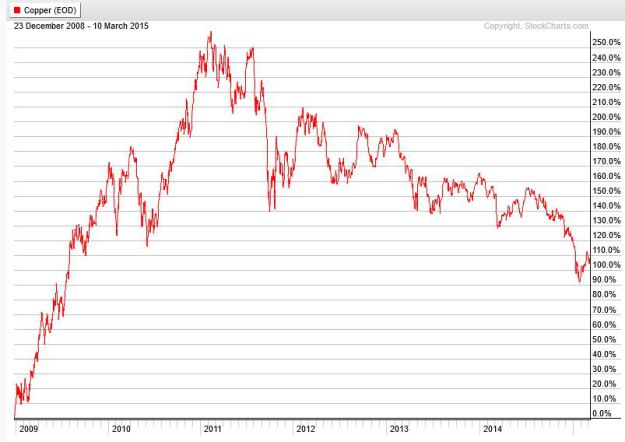
Industrial commodity prices are weaker than they should be in a booming global economy. Look at copper (aka Dr. Copper, an honorary degree for its skill at economic forecasting). The scale shows the price gain since the recessionary trough. Copper rose through 2009 and 2010, peaked in 2011, and has since lost 60% of its gains.

Conclusions
I don’t know what’s happening, and I doubt than anyone does. That’s the tell, the vital message of markets to us since the crash. We’re in a new age, which brings new normals. Despite the hoary wisdom, sometimes it really is different this time. Regime change runs slowly until it becomes rapid, then instantaneous. Nobody rings a bell to announce it.
