🚀 AI-picked stocks soar in May. PRFT is +55%—in just 16 days! Don’t miss June’s top picks.Unlock full list

Natural Gas: Now This Is What A Bottom Looks Like

Published 10/02/2012, 12:50 PM
Updated 07/09/2023, 06:31 AM

A major bottom is significant for two reasons, both equally important for trading.

  1. The low price is in place
  2. The market should trend higher for an extended period of time

Thus is the case for Natural Gas. The weekly chart below shows that Natural Gas has been in a bear trend for 6-1/2 years. During this time the price of the nearby futures contract has declined from a high of 15.780 (Dec. 2005) to a low of 1.902 (Apr. 2012), a decline of 88%. I think this qualifies as a bear market.
Natural Gas, Weekly
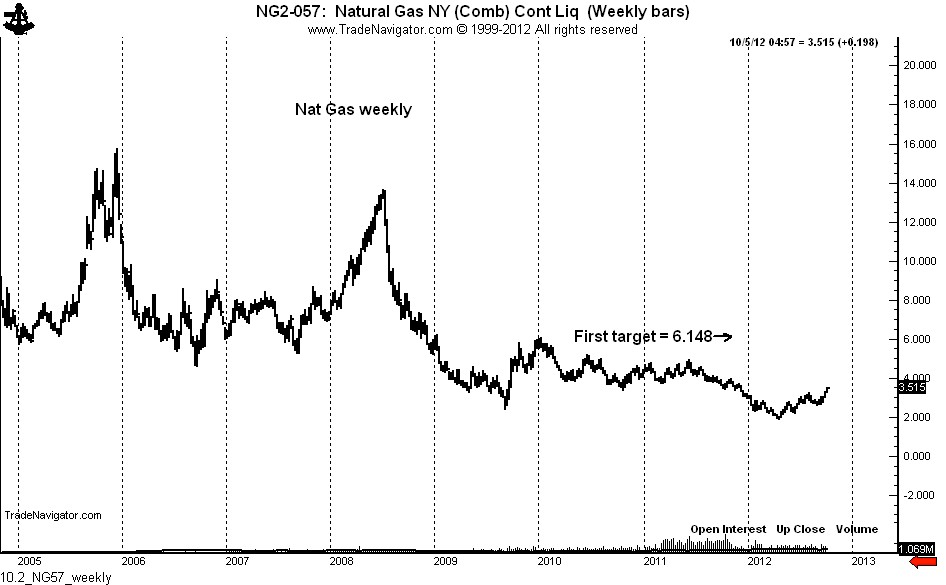
The daily chart now shows a decisive and massive complex H&S bottom in the March 2013 (and all other) contract(s).
Natural Gas, Daily
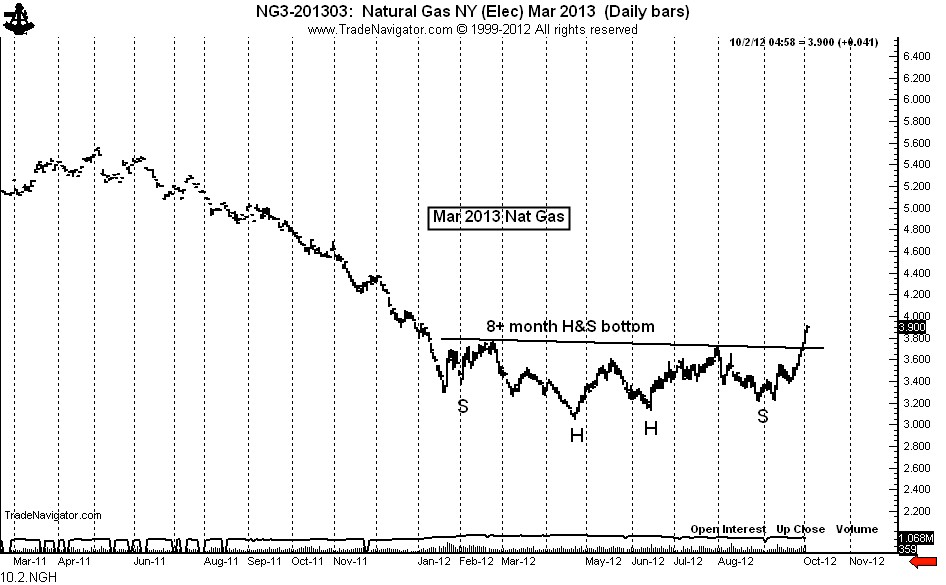
A multi-year bullish trend has begun. The initial target is the 2010 high above 6.000. I must point out that trends are all subject to backing and filling. Natural Gas will be no different. The market has already had a good run. Traders should look for periods of weakness (10 to 15% dips) to be a buyer.

I AM NOT A FAN OF UNG (the ETF). It is possible that the price of futures could advance with the price of UNG actually declining.

Latest comments

Loading next article…
Risk Disclosure: Trading in financial instruments and/or cryptocurrencies involves high risks including the risk of losing some, or all, of your investment amount, and may not be suitable for all investors. Prices of cryptocurrencies are extremely volatile and may be affected by external factors such as financial, regulatory or political events. Trading on margin increases the financial risks.
Before deciding to trade in financial instrument or cryptocurrencies you should be fully informed of the risks and costs associated with trading the financial markets, carefully consider your investment objectives, level of experience, and risk appetite, and seek professional advice where needed.
Fusion Media would like to remind you that the data contained in this website is not necessarily real-time nor accurate. The data and prices on the website are not necessarily provided by any market or exchange, but may be provided by market makers, and so prices may not be accurate and may differ from the actual price at any given market, meaning prices are indicative and not appropriate for trading purposes. Fusion Media and any provider of the data contained in this website will not accept liability for any loss or damage as a result of your trading, or your reliance on the information contained within this website.
It is prohibited to use, store, reproduce, display, modify, transmit or distribute the data contained in this website without the explicit prior written permission of Fusion Media and/or the data provider. All intellectual property rights are reserved by the providers and/or the exchange providing the data contained in this website.
Fusion Media may be compensated by the advertisers that appear on the website, based on your interaction with the advertisements or advertisers.
© 2007-2024 - Fusion Media Limited. All Rights Reserved.