
The unique technical setup in the NASDAQ over the past 30+ days is warning that the markets have lost momentum and may attempt to break below the $14,700, the neckline of the head-and-shoulders pattern. This unique price setup crept up over the past 20+ days as the U.S. markets started to move away from upward price momentum as the Chinese and U.S. market dynamics started to shift away from the continued reflation trade expectations. What does this a head-and-shoulders pattern mean for traders and investors right now?
Head And Shoulders Or Three Mountains – A Critical Topping Pattern
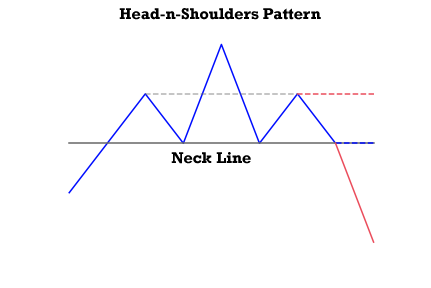
A head-and-shoulders pattern is similar to a Three Mountains Top pattern. It suggests a shift in momentum is taking place and the neckline, which is the support level between the left and right shoulders, is critical in understanding how this pattern will likely play out in the future. The head-and-shoulders example, below, shows an idealistic pattern setup as well as the neckline that represents the critical support level for a price within this extended price pattern.
On real price charts, the importance of this pattern plays out around the neckline and the left and right shoulder levels. The neckline represents the critical support level for the price. The left and right shoulder levels represent critical resistance. If the head-and-shoulders pattern fails to prompt a breakdown below the neckline, then the price will rally above the left and right shoulder levels and break the critical resistance level as it attempts to rally to, and eventually above, the head peak. If the head and shoulders confirms a peak, or top in the market, after the right shoulder has formed, the price will begin to weaken and attempt to test the neckline level. If this critical support level is breached, the price has confirmed a downward trend/momentum has taken control.
The one reason I mention the Three Mountains pattern, which is a Japanese candlestick pattern, is because of the psychological aspect rooted in all Japanese candlestick theory and patterns – the battle between the buyers and sellers (or bulls and bears). The Three Mountains pattern is very similar to the head-and-shoulders pattern in structure and interpretation. Just as I described above, when the neckline is breached, sellers (or bears) have taken control of price action and confirmation of this breakdown would be seen as another new candlestick with a lower close, lower high, and lower low in price.
NASDAQ Head-And-Shoulders Pattern Testing $14,700 Support
The right shoulder of this head-and-shoulders pattern formed over the past 15+ days and confirmed the neckline just recently. The $14,700 level, highlighted by the MAGENTA horizontal line, clearly shows the recent double bottom on the NASDAQ chart, which represents the neckline.
Given how quickly the markets have shifted away from stronger bullish price trending and into this sideways price rotation, it is prudent to discuss the potential that a breakdown below $14,700 may happen and that price may attempt to move downward – trying to find new support.
If the NASDAQ is able to hold above $14,700 over the next few days/weeks, then we would watch the $15,350 level as the shoulder resistance level. Once the price breaks above this level and confirms, we would expect a bigger price rally to start.

Traders Shift Expectations As Fear And Uncertainty Unsettle Trends
Even though we still believe the markets are within a moderately strong bullish price trend and we have yet to see any real confirmation of a downward price trend, we also have to acknowledge the head-and-shoulders setup on the NASDAQ that may prompt a moderate downside price correction. The reality of the global market environment has changed dramatically over the past 25+ days. Worries about a continued Chinese credit/debt collapse have taken center stage while the U.S. deals with its own unique set of issues. This extreme level of uncertainty in the markets can, and often does, promptly extended volatility and moderate market corrections.
For example, the COVID-19 market collapse happened because of the uncertainty, and certainty, that was related to the sudden onset of the COVID virus. The late 2018 market correction took place because traders/investors believe the Federal Reserve had pushed the Fed Funds Rate too high – which changed expectations related to market dynamics. All it takes, in reality, is for traders and investors to become “spooked” for a 15% to 20% correction to unload on the markets.

Either way, if the markets settle and begin another rally phase, or if the markets break down below the neckline, this type of price pattern sets up incredible opportunities for traders. A breakdown in price would represent a broader market reversion event that will find support, eventually, and set up another recovery rally phase. This process allows traders to pull capital away from risks and reinvest capital when the market dynamics are suitable for a new bullish price rally. Of course, traders can attempt to capitalize on the breakdown price move as well with options, shorts or inverted ETFs. If the markets hold above the $14,700 level and begin another rally phase, then traders should expect another 7% to 12% rally in the markets – pushing the U.S. stock market to new all-time highs again.
Instead of looking at this pattern in price as a concerning warning of a potential top, think of it as an opportunity for you to profit from price rotation if it happens. Traders want moderate volatility in the markets because it allows us to identify and profit from bigger trends. Now is the time to prepare for the huge opportunities the markets will present throughout the end of 2021 and into 2022.