Get 40% Off
👀 👁 🧿 All eyes on Biogen, up +4,56% after posting earnings. Our AI picked it in March 2024.
Which stocks will surge next?
Unlock AI-picked Stocks

Mylan Stock To Leave Three Painful Years Behind

Published 04/25/2018, 09:01 AM
Updated 07/09/2023, 06:31 AM

Three years ago, in mid-April 2015, Mylan (NASDAQ:MYL) stock was trading in the vicinity of $77 a share following a phenomenal rally from as low as $5.75 in late-October 2008. Currently above $40, Mylan is trying to recover from its 61.7% selloff which dragged the share price to $29.39 by August, 2017. Will the bulls be able to recover or simply fall into another bearish ambush? Let’s see if we can find the answer to this question with the help of the Elliott Wave Principle. Our analysis begins with the weekly price chart of Mylan stock below.
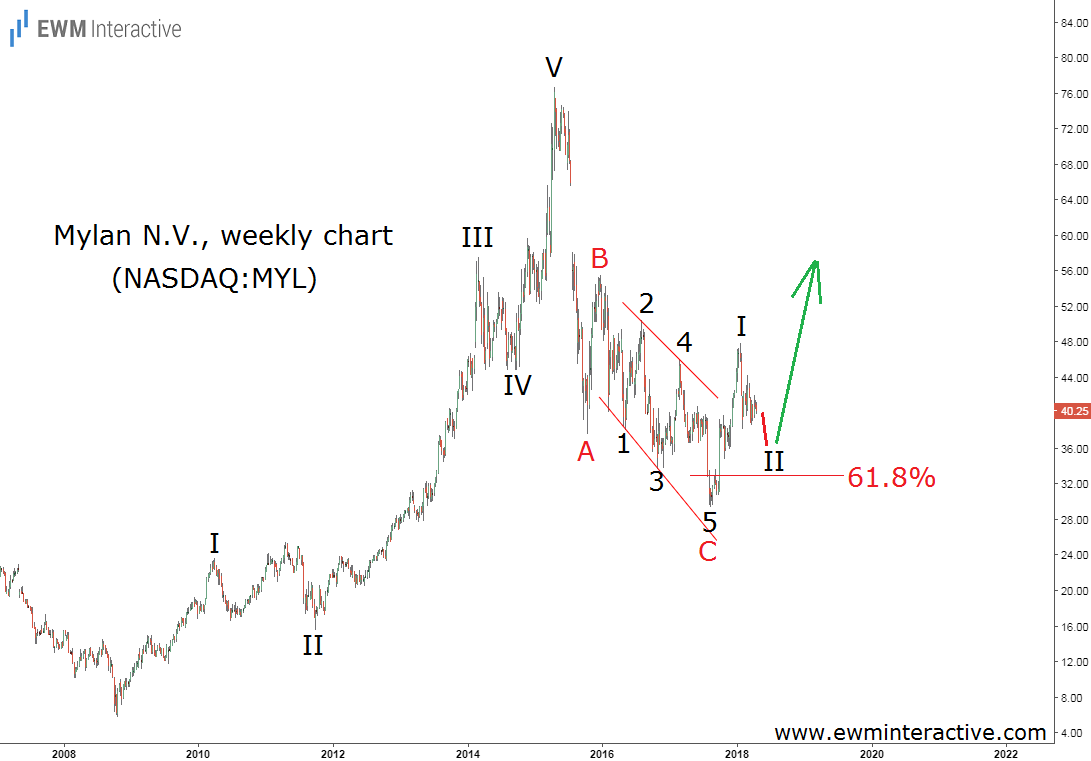
Mylan NN.V Weekly Chart


This chart shows that the bull market from $5.75 to $76.69 has developed as a five-wave impulse pattern, labeled I-II-III-IV-V. The market took the guideline of alternation into account, since wave II looks like an expanding flat correction, while wave IV is much sharper. According to the theory, every impulse is followed by a three-wave correction in the other direction. Naturally, Mylan’s decline to $29.39 looks like a simple A-B-C zigzag retracement, whose wave C is an expanding ending diagonal. The 61.8% Fibonacci level has been breached slightly, but it still managed to help the bulls out and lead Mylan stock to $47.82 in January, 2018. Now let’s move on to the 4-hour chart of MYL and see if we can trust this recent strength.
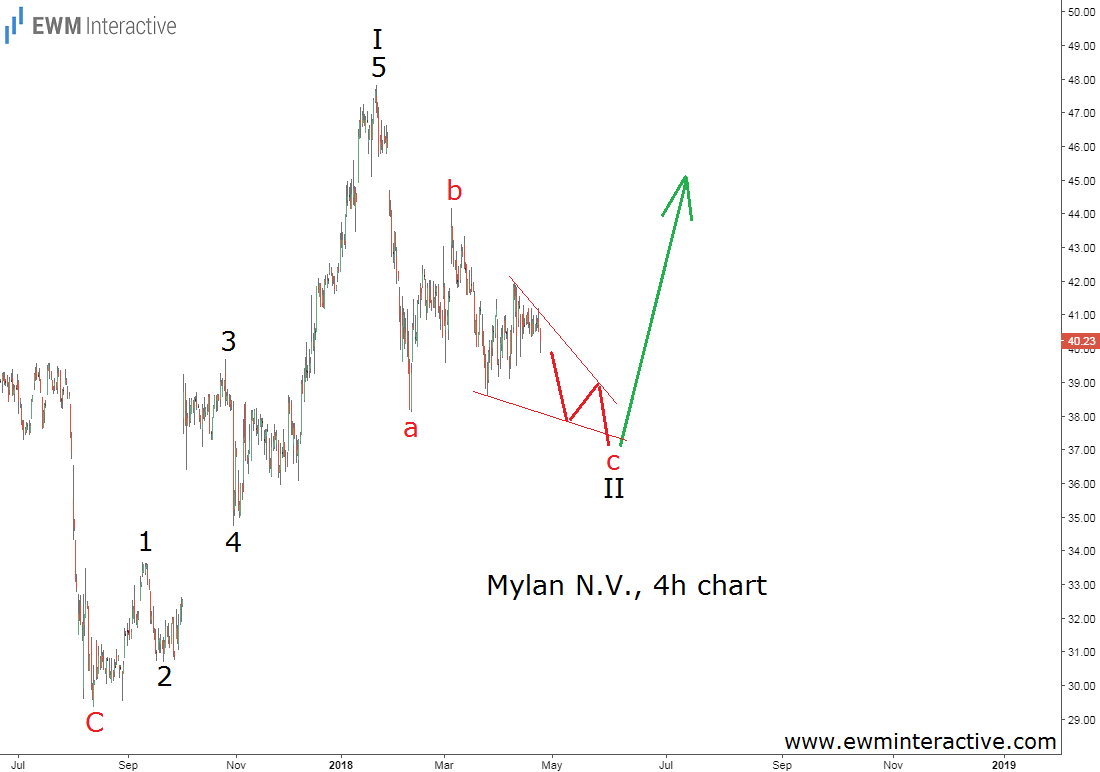
Mylan N.V Weekly Chart

The rebound from $29.39 to $47.82 has a five-wave structure, as well. Wave 3 is not the longest among waves 1, 3 and 5, since wave 5 is extended, but it is still longer than wave 1, so there is no violation of the Wave Principle’s rules. If this count is correct, Mylan stock is in another a-b-c zigzag in wave II, whose wave “c” is still under construction. However, despite all the pain Mylan shareholders had to suffer during the last three months, and the last three years if we consider the bigger picture, the stock’s weekly and hourly charts both point up. This means that as long as the bottom at $29.39 holds, this drug manufacturer’s future remains bright, at least according to the charts.

3rd party Ad. Not an offer or recommendation by Investing.com. See disclosure here or remove ads .

Original post

Latest comments

Risk Disclosure: Trading in financial instruments and/or cryptocurrencies involves high risks including the risk of losing some, or all, of your investment amount, and may not be suitable for all investors. Prices of cryptocurrencies are extremely volatile and may be affected by external factors such as financial, regulatory or political events. Trading on margin increases the financial risks.
Before deciding to trade in financial instrument or cryptocurrencies you should be fully informed of the risks and costs associated with trading the financial markets, carefully consider your investment objectives, level of experience, and risk appetite, and seek professional advice where needed.
Fusion Media would like to remind you that the data contained in this website is not necessarily real-time nor accurate. The data and prices on the website are not necessarily provided by any market or exchange, but may be provided by market makers, and so prices may not be accurate and may differ from the actual price at any given market, meaning prices are indicative and not appropriate for trading purposes. Fusion Media and any provider of the data contained in this website will not accept liability for any loss or damage as a result of your trading, or your reliance on the information contained within this website.
It is prohibited to use, store, reproduce, display, modify, transmit or distribute the data contained in this website without the explicit prior written permission of Fusion Media and/or the data provider. All intellectual property rights are reserved by the providers and/or the exchange providing the data contained in this website.
Fusion Media may be compensated by the advertisers that appear on the website, based on your interaction with the advertisements or advertisers.
© 2007-2024 - Fusion Media Limited. All Rights Reserved.