Shares of Microsoft Corporation (NASDAQ:MSFT) made its way to the gainers of the day on Monday, which stood at $67.96 target or 7.00% above today’s share price of $63.51, marking an upside bias for the $491.56 billion company.
Subsequently, if the company will hit a price target of $67.96, the company will be worth over $34.41 billion. In an analyst’s outlook, trading with an all time high trading stocks, corresponds to a winning strategy even if the pullback rate is high, investors can positively trade if a correct risk management is utilized.
Microsoft Corporation has skyrocketed to 20.20% since May 16, 2016, with a trading volume of approximately 12.09 million shares, which has outperformed the S&P 500 by about 10.94%. Analysts are closely watching for the scheduled earnings report of the tech giant on January 26. The company is expected to post an earnings per share (EPS) of $0.75, 0.00% or $0.00 from last year’s reading of $0.78 per share.
Additionally, Microsoft Corp’s profit is expected to reach $6.04 billion for 20.36 P/E of the $0.78 EPS will be met. Ahead of the reported $0.76 actual earnings per share, analysts now estimate an EPS growth of 2.63%.
Microsoft Stock Rules the Cloud
Microsoft stock has gained a significant 135% since 2013, with the strategic moves of CEO Satya Nadella, who has made a big stake on the cloud.
MSFT Stock Cloud Advantage: Infrastructure
During the mid-1970s, the tech giant has been focusing on building software for core functions like operating systems and productivity applications. Given this experience, the company’s cloud-computing efforts has essentially benefited.
Some of the metrics that need to be considered are the Office 365, which has more than 85 million monthly active users (MAUs), and rallied by 40% in a year-over-year basis. Evidently, the Outlook counts about 45 million MAUs on iOS and Android, which edged higher by 70%. Moreover, there are 400 million monthly active devices (MADs) on Windows 10, while Dynamics CRM Online paid seats expanded by over 2.5 times.
Analysts’ Recommendation
Many analysts are closely watching on the stock, in which they gave a mean target price of $64.00, with a mean recommendation of 2.10 (1=Buy, 5=Sell). Apparently, some analysts’ consensus recommendation rated an Outperform rating with a mean recommendation of 2.06 on a scale of 1-5.
Current Stance of Microsoft Corp. Stock
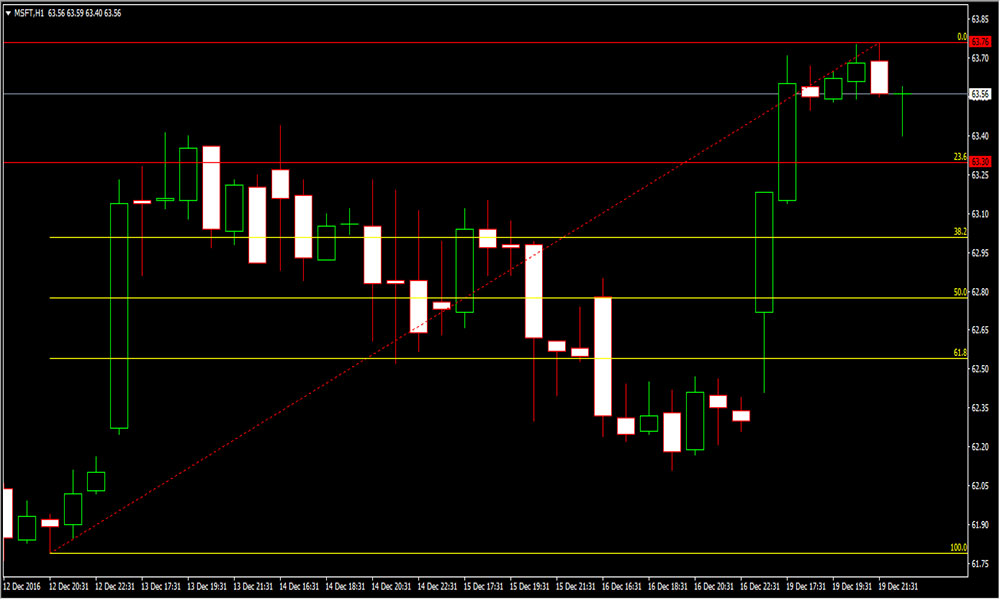
The chart below illustrates Microsoft Corporation stock ahead of the scheduled earnings report on January 26. Given a bullish tone of the stock, it is shown here that the stock is likely consolidating after sharply rallying the in the previous sessions.
The stock price nearly touched resistance 63.76, but later centered between both its support and resistance. Thus, the stock is currently prone to an upside bias as soon as the candle breaks through its resistance level.

Conclusion
As shares of Microsoft Corporation are currently in a bullish tone, market participants are recommended to wait on the sidelines as there aren’t any supporting candles present as of writing.
