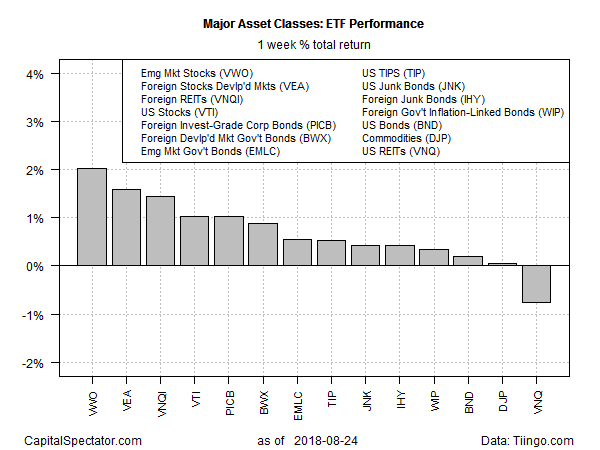
Gains in nearly every corner of global markets generated a broad tailwind for the major asset classes last week, based on a set of exchange-traded products. With the exception of US real estate investment trusts (REITs), buyers bid up prices across the board.
Stocks in emerging markets led last week’s rally. Vanguard FTSE Emerging Markets (NYSE:VWO) jumped 2.0%, posting its first weekly gain in a month. The ETF, however, remains close to its lowest price for the year to date, although some analysts see the slide in 2018 as a source of opportunity.
“Because of the downdraft and how emerging markets like to sell off all at once, thinking that they all share the same characteristics, which they don’t, it’s often a buying opportunity,” observes Robert Samson, a portfolio manager at Nikko Asset Management in Singapore. As an example, he cites the current price-to-earnings ratio of Asia ex-Japan stocks at roughly 13, which he adds is substantially below average and at the lowest in more than two years. “This is not to say they cannot get cheaper, but we see reasonable upside when the stress subsides.”
With that in mind, it’s interesting to note that iShares MSCI All Country Asia ex Japan (NASDAQ:AAXJ) posted a modestly firmer gain last week vs. VWO — 2.4% vs. 2.0%.
Last week’s only loser among the major asset classes: US REITs. Vanguard REIT (NYSE:VNQ) slumped 0.8%. The setback follows a sharp rally in recent months that’s lifted the ETF to a level that continues to leave the ETF close to a two-year this month, even after last week’s slide.

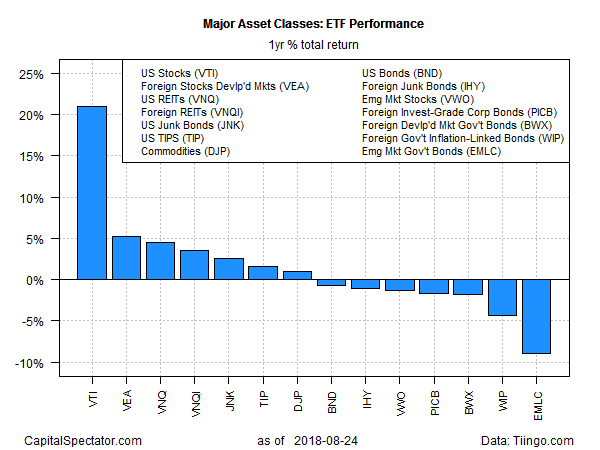
For the one-year comparison, US stocks continue to dominate the horse race by a wide margin. Vanguard Total Stock Market (NYSE:VTI) closed with a 21.0% total return on Friday – far above the rest of the field. Indeed, the second-best one-year performance is a relatively modest 5.2% one-year gain for equities in the developed markets via Vanguard FTSE Developed Markets (NYSE:VEA).
Bonds issued by governments in emerging markets continue to post the biggest one-year loss. VanEck Vectors JP Morgan EM Local Currency Bd (NYSE:EMLC) is off 8.9% over the past year, as of Friday’s close.

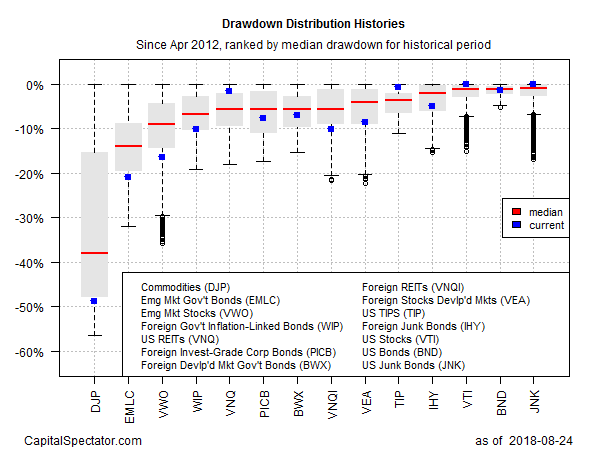
Ranking the major asset classes by drawdown continues to show broadly defined commodities with the biggest peak-to-trough slide. The iPath Bloomberg Commodity Total Return Exp 12 June 2036 (NYSE:DJP) is nearly 50% below its previous peak.
On the flip side, junk bonds in the US are still posting the smallest current drawdown for the major asset classes. SPDR Barclays High Yield Bond (NYSE:JNK) closed last week fractionally below its previous peak.

