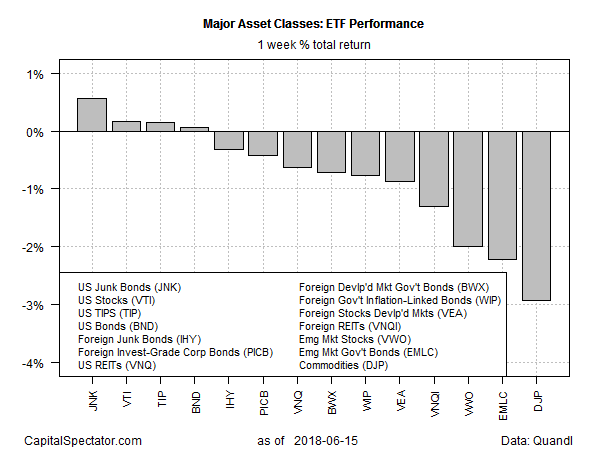
Selling dominated global markets in last week’s trading. US stocks and bonds posted gains, but the rest of the major asset classes retreated over the five trading days through June 15, based on a set of exchange traded products.
The biggest winner: junk bonds in the US. SPDR Barclays (LON:BARC) High Yield Bond (NYSE:JNK) gained 0.6%, rising for a second straight week. The ETF settled on Friday at its highest weekly close since January.
The latest rise in junk bond prices was surprising in a week when the Federal Reserve raised interest rates and signaled that more policy tightening is planned. By some accounts that’s a reason to ease up on the riskiest tier of fixed income.
“But investors in the riskiest corporate junk debt are totally blowing off the Fed,” notes Wolf Street, a finance blog. “They’re floating around in their own dream world, facing a very rude awakening.”
Last week’s biggest loser: broadly defined commodities. The iPath Bloomberg Commodity Total Return Exp 12 June 2036 (NYSE:DJP) slumped 2.9% — the ETN’s third weekly slide in a row.
The Wall Street Journal on Friday noted that fears of a trade war between the US and China are weighing on prices for a wide range of raw materials. “We now have potential for a full-blown trade war,” said Bart Melek, who heads commodity strategy at TD Securities. “If I was an investor who made money, I may want to cash out here.”

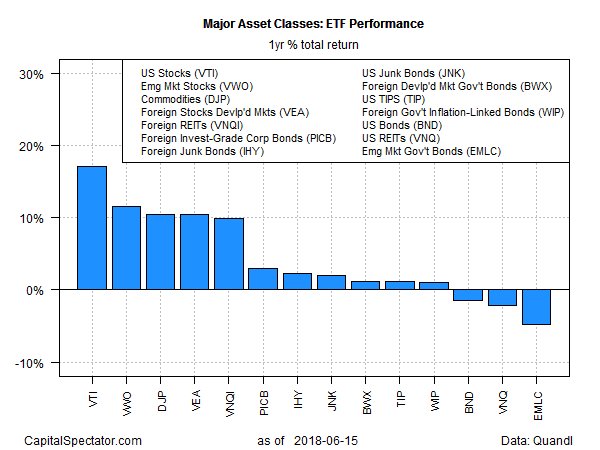
For the one-year trend, US equities dominate the horse race by a sizable margin for the major asset classes. Vanguard Total Stock Market (NYSE:VTI) was up a strong 17.1% for the trailing 12-month period through last week’s close. The gain marks a healthy premium over the second-place return – 11.5% — for emerging markets stocks via Vanguard FTSE Emerging Markets (NYSE:VWO).

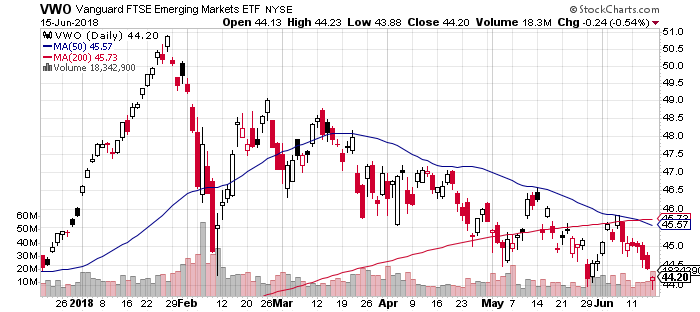
While VWO’s second-place finish for one-year results looks encouraging, this corner of the equity market has been fading via persistent selling this year. At last week’s close, VWO was close to its lowest price for the year to date and the ETF’s trend profile for the last several months suggests that the fund is still vulnerable on the downside.

The biggest setback for the one-year window at the moment: bonds in emerging markets. VanEck Vectors JP Morgan EM Local Currency Bd (NYSE:EMLC) has shed 4.4%.
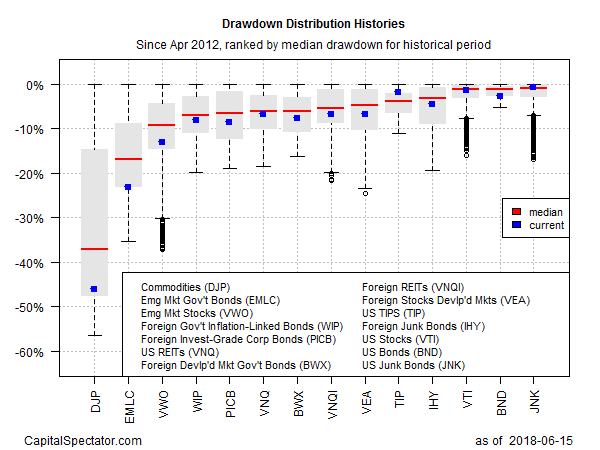
Ranking the major asset classes by drawdown continues to leave broadly defined commodities deep in the hole. DJP is posting the steepest peak to trough decline – nearly 50%.
On the flip side, the US SPDR Barclays High Yield Bond (NYSE:JNK) is red hot for trading close to peak price. As of Friday’s close, JNK is off less than 1% from its previous peak.

