Get 40% Off
🎁 Free Gift Friday: Copy Legendary Investors' Portfolios in One ClickCopy for Free

More Patience Required From Gold Investors

Published 03/18/2019, 08:48 AM
Updated 07/09/2023, 06:31 AM

Gold Weekly Chart

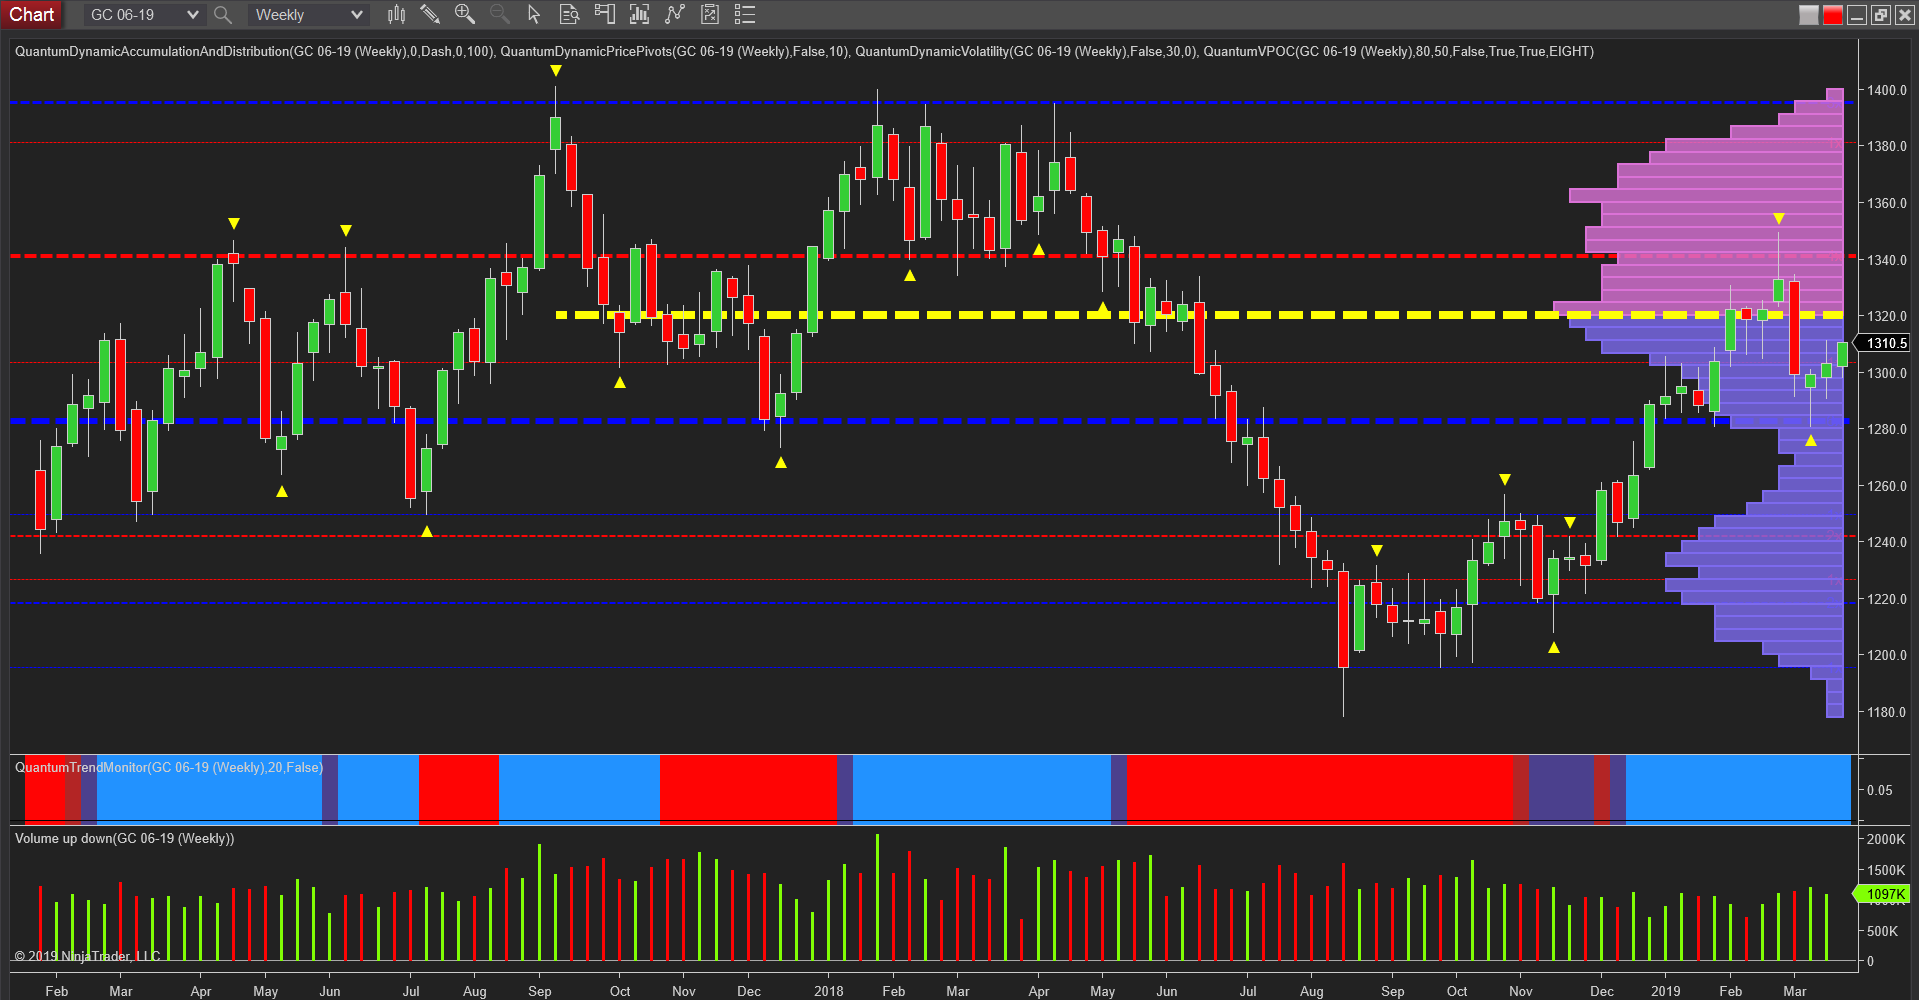
Gold investors must be wondering when the precious metal will find some sustained momentum and finally break free from the trading range which has seen the price of gold oscillate in a $200 range for the last few years. And a look at the weekly chart sets really sets the scene for investors for the next few months.

First, the strong support platform at $1280 per ounce came into play once again in March, as shown with the blue dashed line of the accumulation and distribution indicator, helping to propel gold higher once more, as occurred at the start of the year. However, ahead now are some serious obstacles to future progress higher, not least of which is the volume point of control which is anchored in the $1320 per ounce region and denoted with the yellow dashed line.

This denotes the deepest concentration of volume on the chart, and as such we are likely to see congestion build once more as we approach this region. Should the metal manage to break higher, the next issue is the strong resistance at $1340 per ounce and denoted with the red dashed line. Even if this level is also breached, sustained volume extends from here through to the $1380 per ounce region, before further price based resistance then comes into play both here and at the key $1400 per ounce level.
Gold Monthly Chart

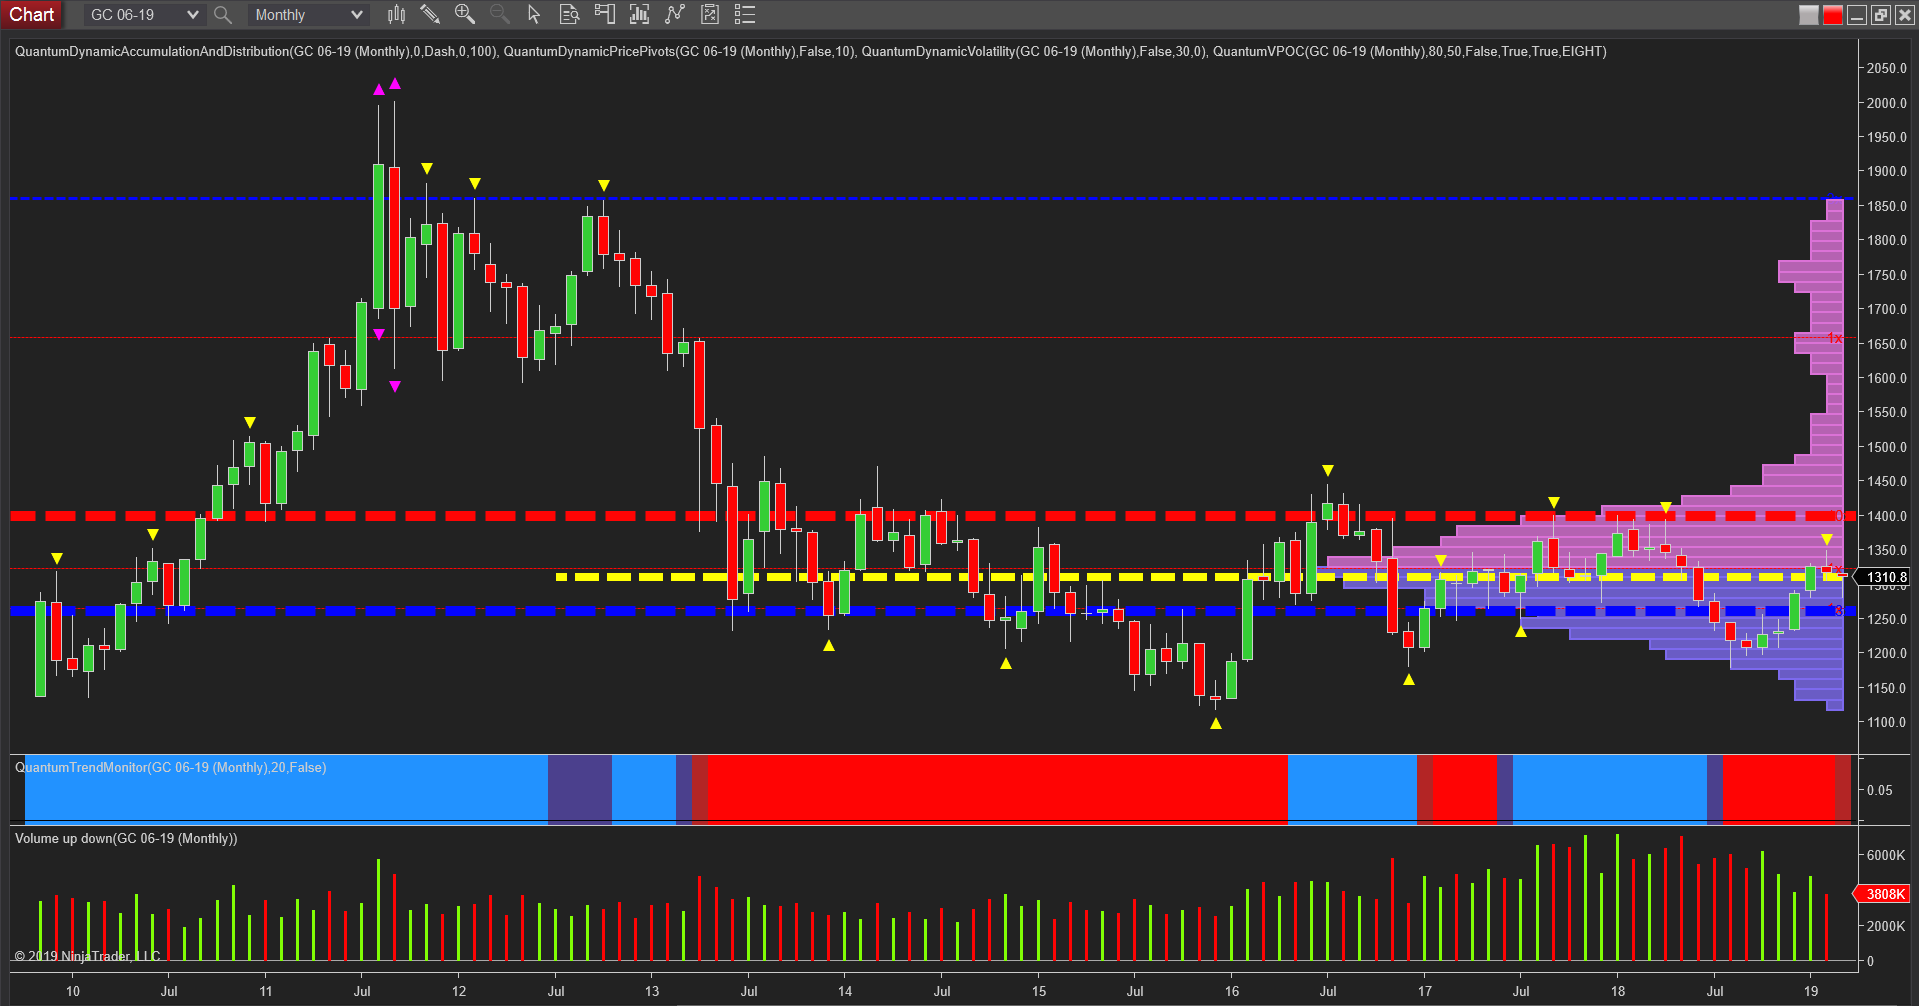
Finally moving to the monthly chart, highlights the strength of this last region which is immense, and does reinforce the problems for gold longer term. It is this level greater than any other which is likely to dictate the longer term outlook for gold investors from a technical perspective. If the gold price does break above this price point, this will surely open the way for the development of a longer term bullish trend – and who knows – the 1400’s will be left far behind with a move to the 15’s and 16’s.

3rd party Ad. Not an offer or recommendation by Investing.com. See disclosure here or remove ads .

Latest comments

gold will hover around 1310 and 1290
Risk Disclosure: Trading in financial instruments and/or cryptocurrencies involves high risks including the risk of losing some, or all, of your investment amount, and may not be suitable for all investors. Prices of cryptocurrencies are extremely volatile and may be affected by external factors such as financial, regulatory or political events. Trading on margin increases the financial risks.
Before deciding to trade in financial instrument or cryptocurrencies you should be fully informed of the risks and costs associated with trading the financial markets, carefully consider your investment objectives, level of experience, and risk appetite, and seek professional advice where needed.
Fusion Media would like to remind you that the data contained in this website is not necessarily real-time nor accurate. The data and prices on the website are not necessarily provided by any market or exchange, but may be provided by market makers, and so prices may not be accurate and may differ from the actual price at any given market, meaning prices are indicative and not appropriate for trading purposes. Fusion Media and any provider of the data contained in this website will not accept liability for any loss or damage as a result of your trading, or your reliance on the information contained within this website.
It is prohibited to use, store, reproduce, display, modify, transmit or distribute the data contained in this website without the explicit prior written permission of Fusion Media and/or the data provider. All intellectual property rights are reserved by the providers and/or the exchange providing the data contained in this website.
Fusion Media may be compensated by the advertisers that appear on the website, based on your interaction with the advertisements or advertisers.
© 2007-2024 - Fusion Media Limited. All Rights Reserved.