
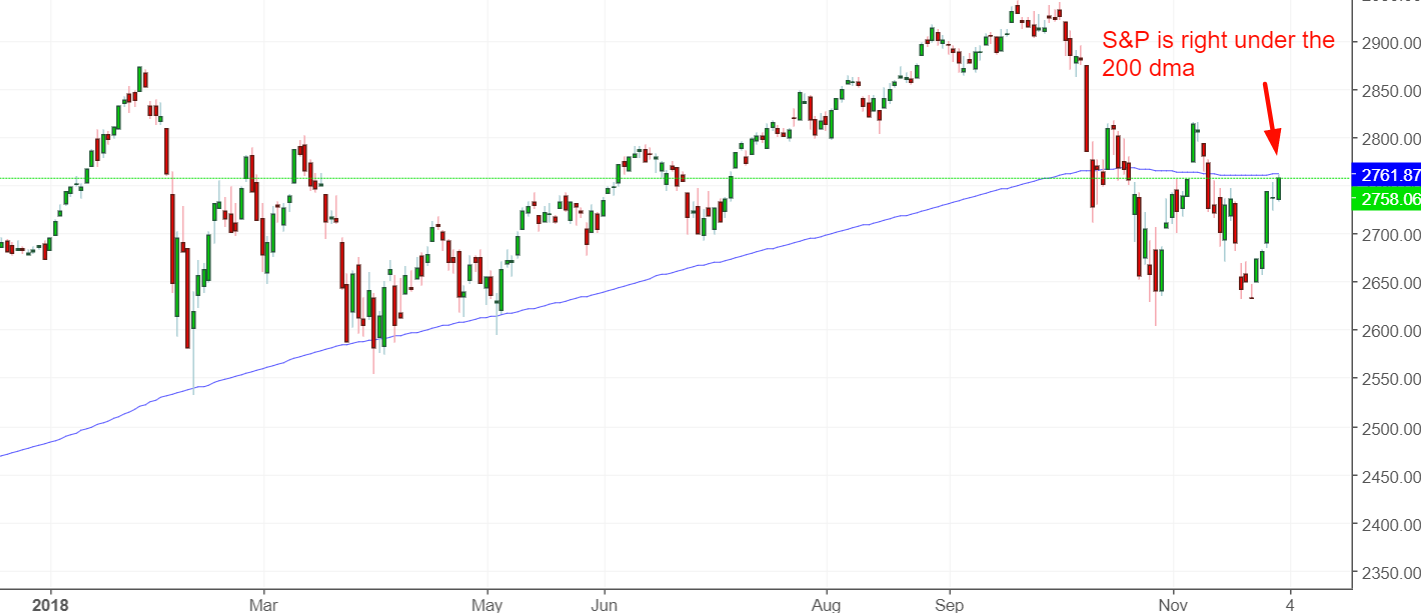
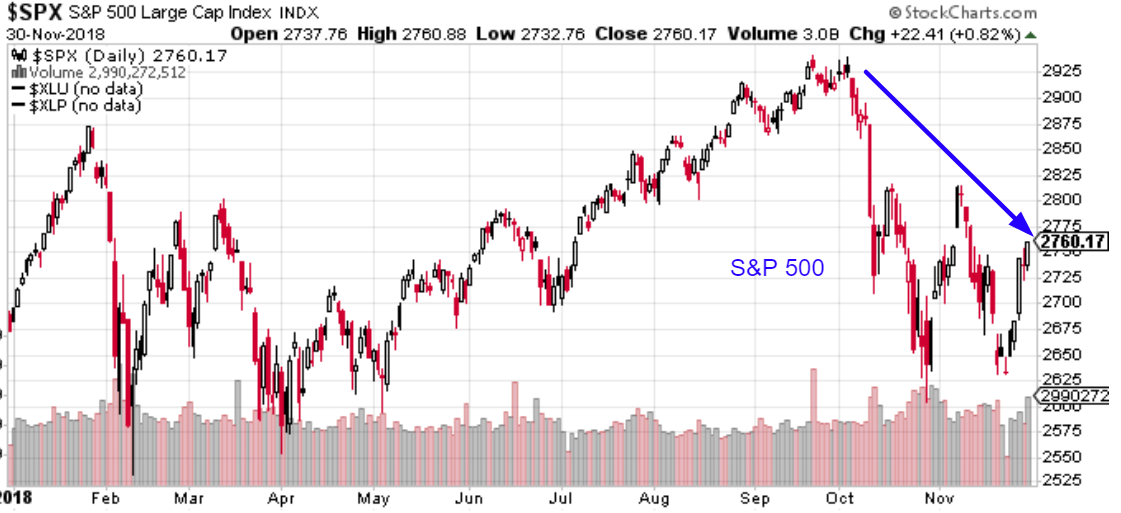
The S&P 500 is sitting right under its 200 day moving average right now. The stock market is demonstrating various late-cycle signs. These late-cycle signs are not immediately long term bearish, but it demonstrates that the long term winds will change in 2019.
Let’s determine the stock market’s most probable direction by objectively quantifying technical analysis. For reference, here’s the random probability of the U.S. stock market going up on any given day, week, or month.

*Probability ≠ certainty.
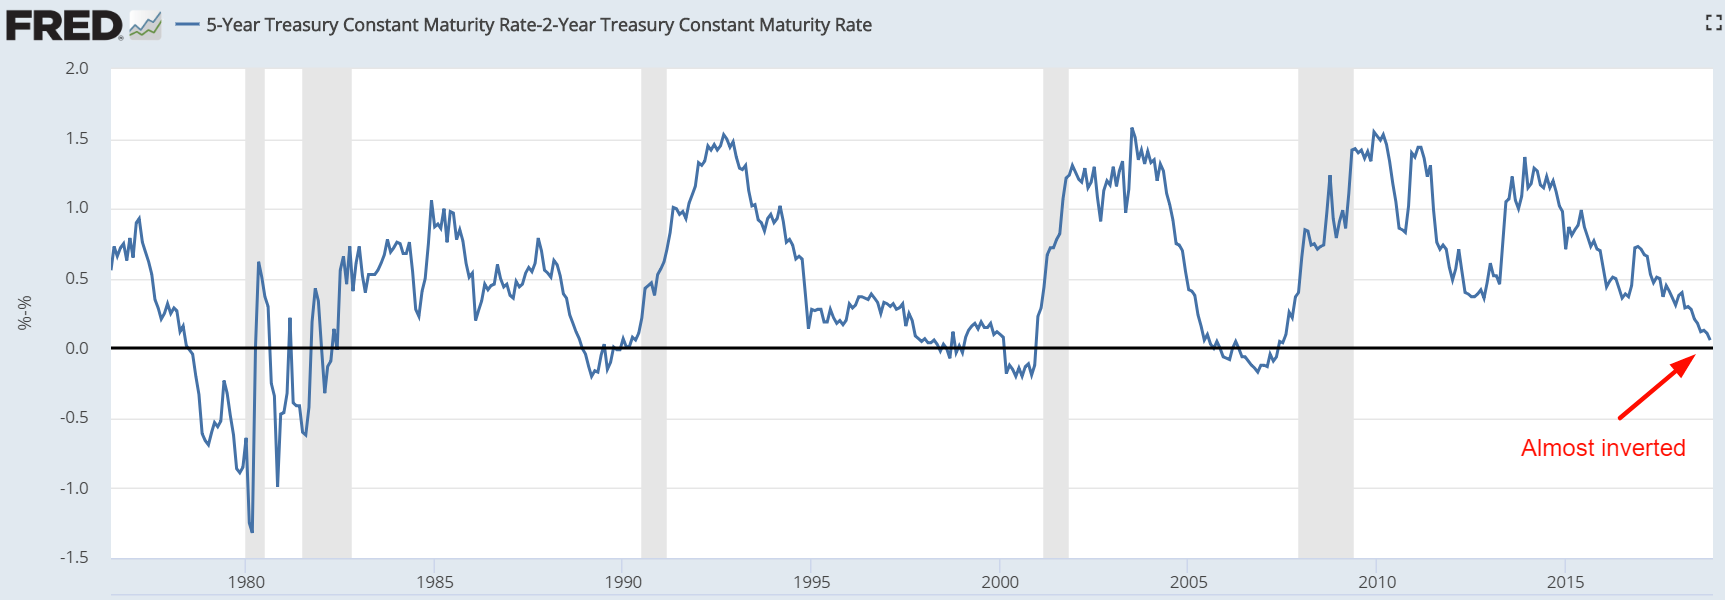
Yield curve
Various parts of the yield curve will invert one at a time over the next 6-9 months. As Bloomberg mentioned, the first part of the yield curve to invert will be the 5 year – 2 year and 5 year – 3 year yield curve.
Here’s what happened next to the S&P 500 when the 5 year – 2 year yield curve inverted for the first time in each economic expansion.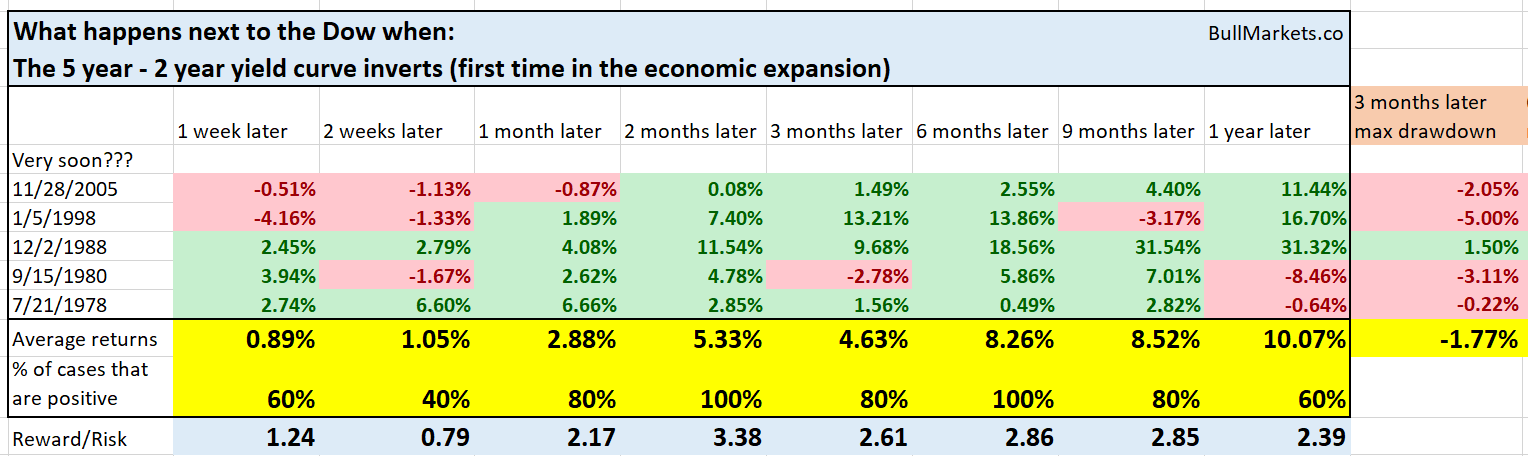
The stock market does well for the next half year, after which forward returns deteriorate. What investors should really watch out for is a spike in the yield curve. That typically happens because the economy is deteriorating significantly, so the Fed cuts short term rates. Perhaps this will happen in the second half of 2019, or 2020. We’ll see.
Oil
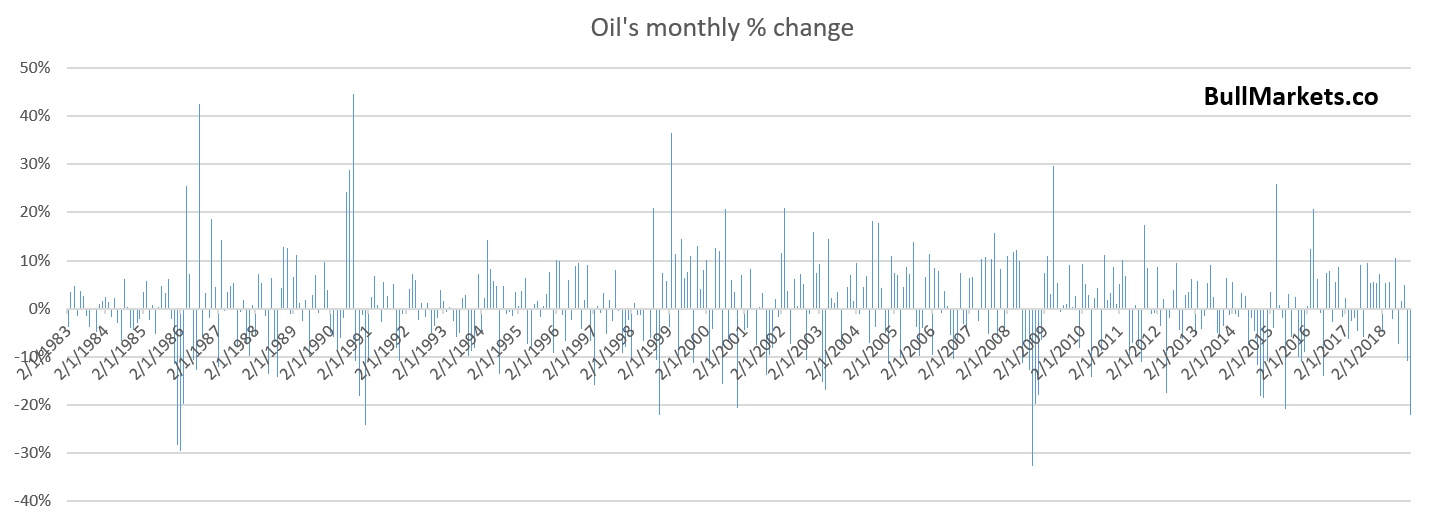
Oil crashed in November, falling more than -22%. This is among the biggest monthly drawdowns ever. The last time oil fell more than -22% was October 2008. (Oil is an inelastic market, hence small changes in supply and demand can have a big impact on its price).
Here’s what happens next to the S&P 500 when oil falls -20% or more in 1 month.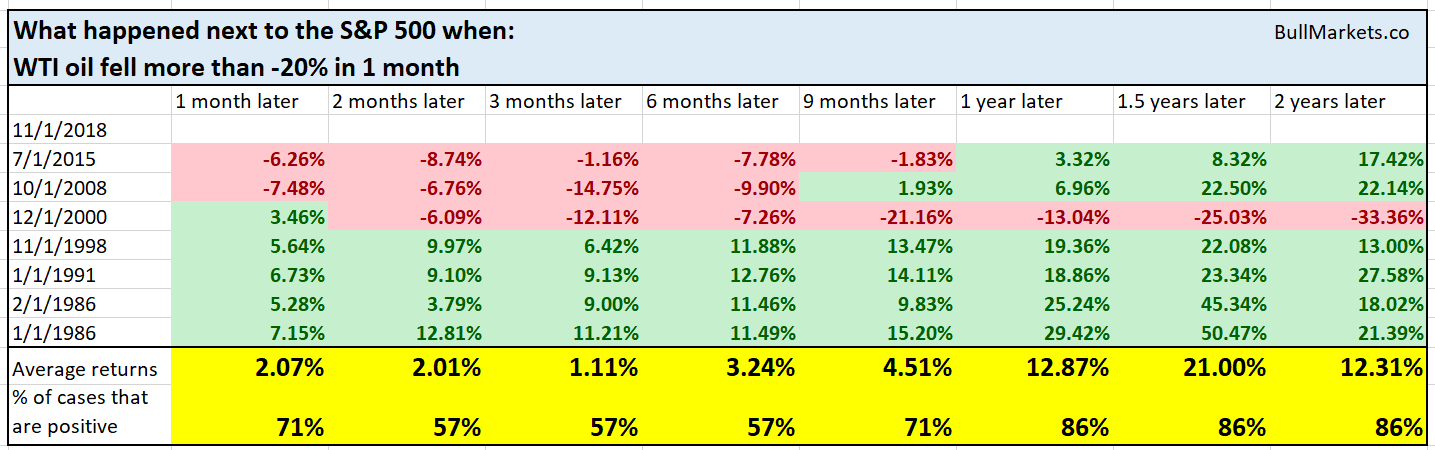
Here’s what happens next to oil when oil falls -20% or more in 1 month.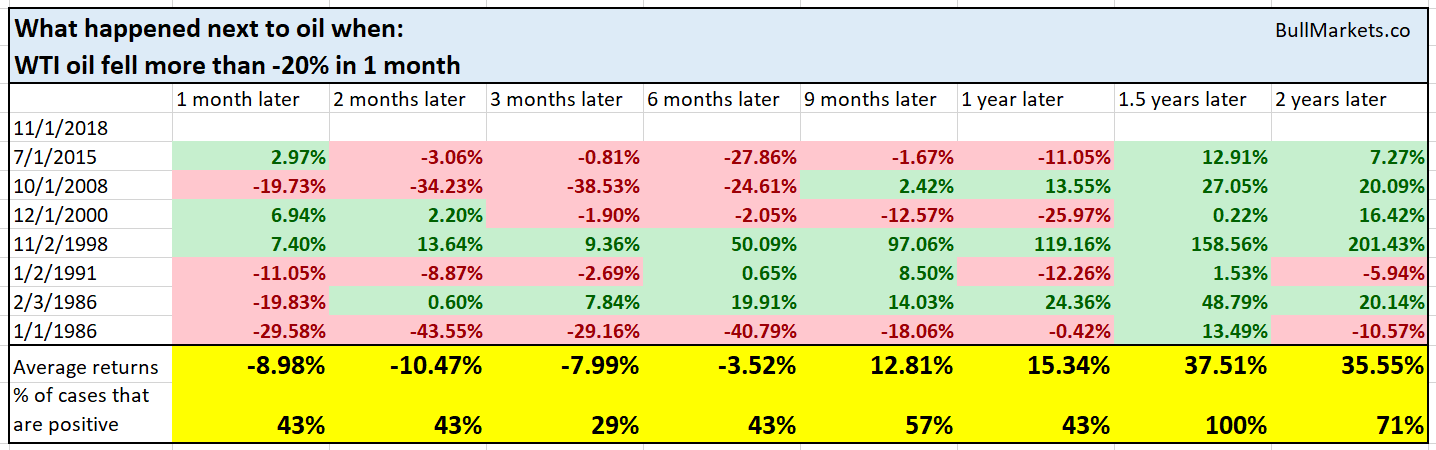
As you can see, oil tends to fall even more, while this is bullish for stocks.
But will this be bullish for stocks this time around? I don’t think so. I think this factor is mostly irrelevant to the stock market this time. Neither bullish nor bearish.
In the past, a decline in oil prices was bullish for the U.S. stock market and economy because the U.S. was net importer of oil.
- Falling oil is bad for countries that are net exporters of oil (e.g. Saudi Arabia). Falling oil hurts oil producers and it benefits consumers.
- Falling oil is good for countries that are net importers of oil. Oil producers within the country will be hurt, but the benefit to consumers outweighs the harm done to producers.
In the past, the U.S. was a massive net importer of oil, But thanks to shale, the U.S. is getting increasingly close to being a net exporter of oil. This time, the harm done to U.S. producers of oil will probably be equivalent to the benefit to U.S. consumers. So on balance, the result is negligible. Neither good nor bad for the U.S. economy as a whole.
SKEW
SKEW is an index that tries to measure the probability of a black swan event. SKEW has tanked over the last 2 months while the U.S. stock market has fallen.
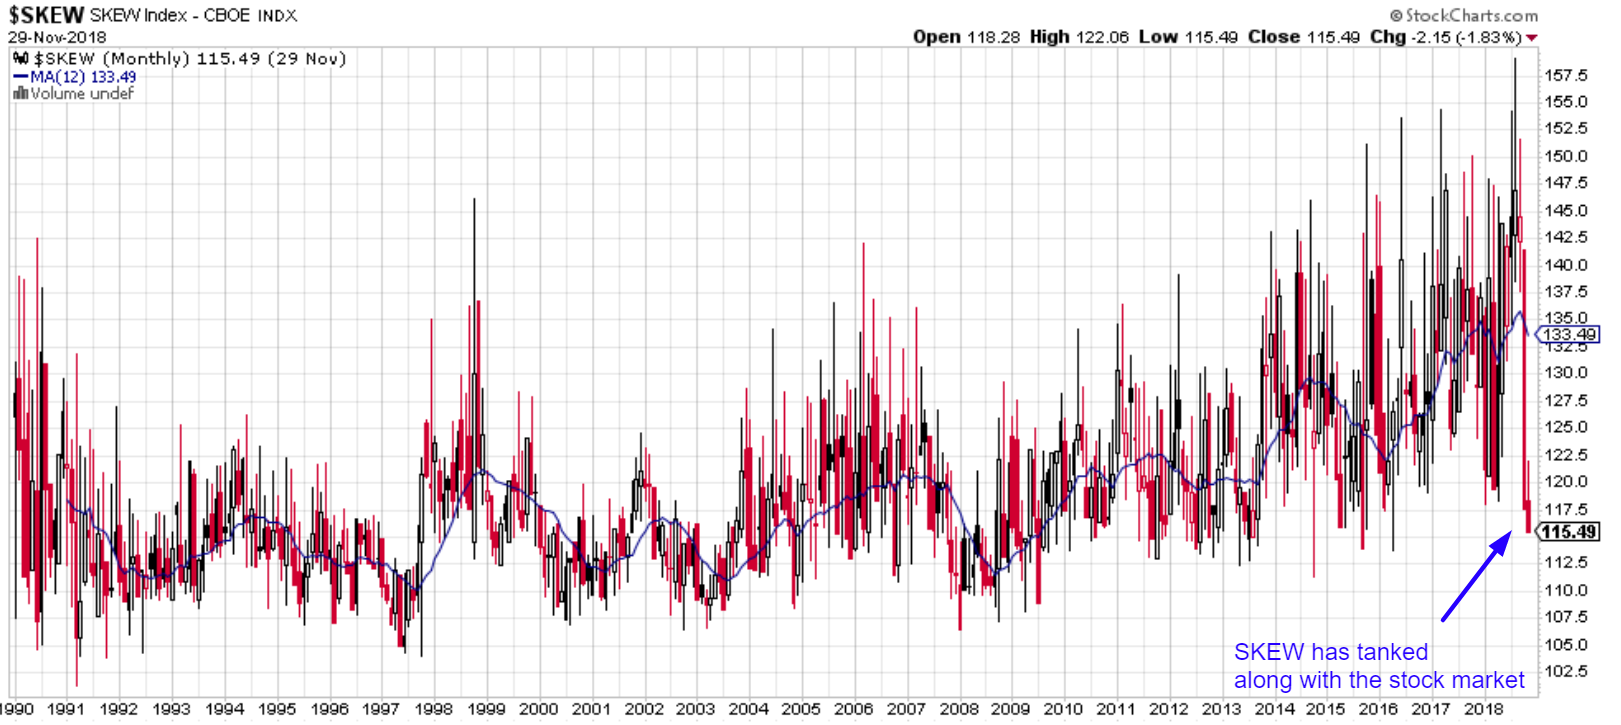
SKEW is now more than -13% below its 1 year (12 month) moving average. This has never happened before, from 1990 – present.
Let’s relax the parameters a little. Here are the 3 cases from 1990 – present in which SKEW was more than -10% below its 1 year moving average.
- November 2018
- October 2018
- March 1991
Here’s a chart of the S&P after March 1991.
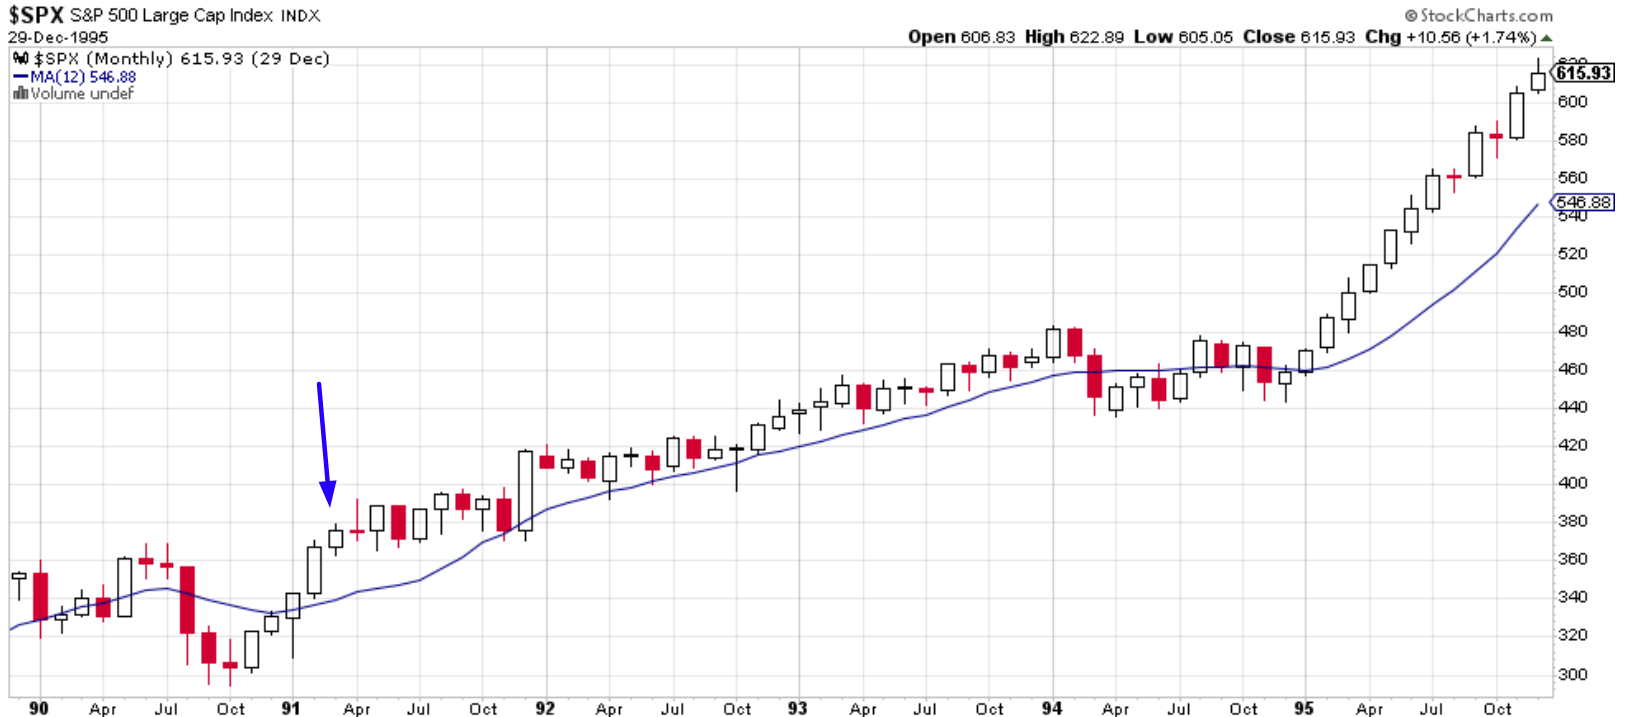
In this study, n is basically = 1. Take this with a grain of salt.
Big reversa
Bloomberg posted the following chart.
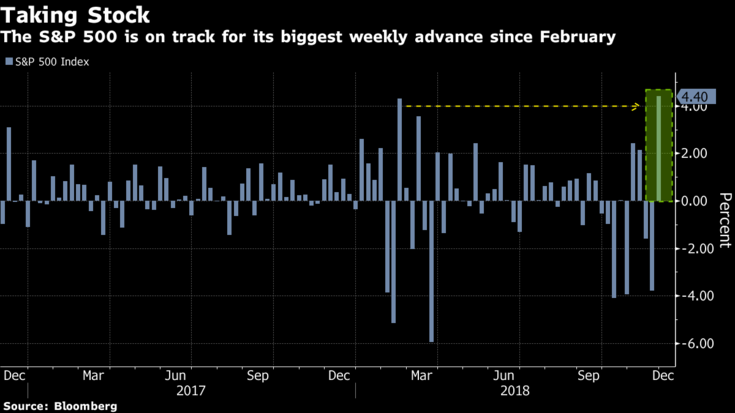
Here’s what happened next to the S&P 500 when it fell more than -3.5% the previous week and rose more than 4.5% this week (i.e. a strong upwards reversal).
*Data from 1928 – present
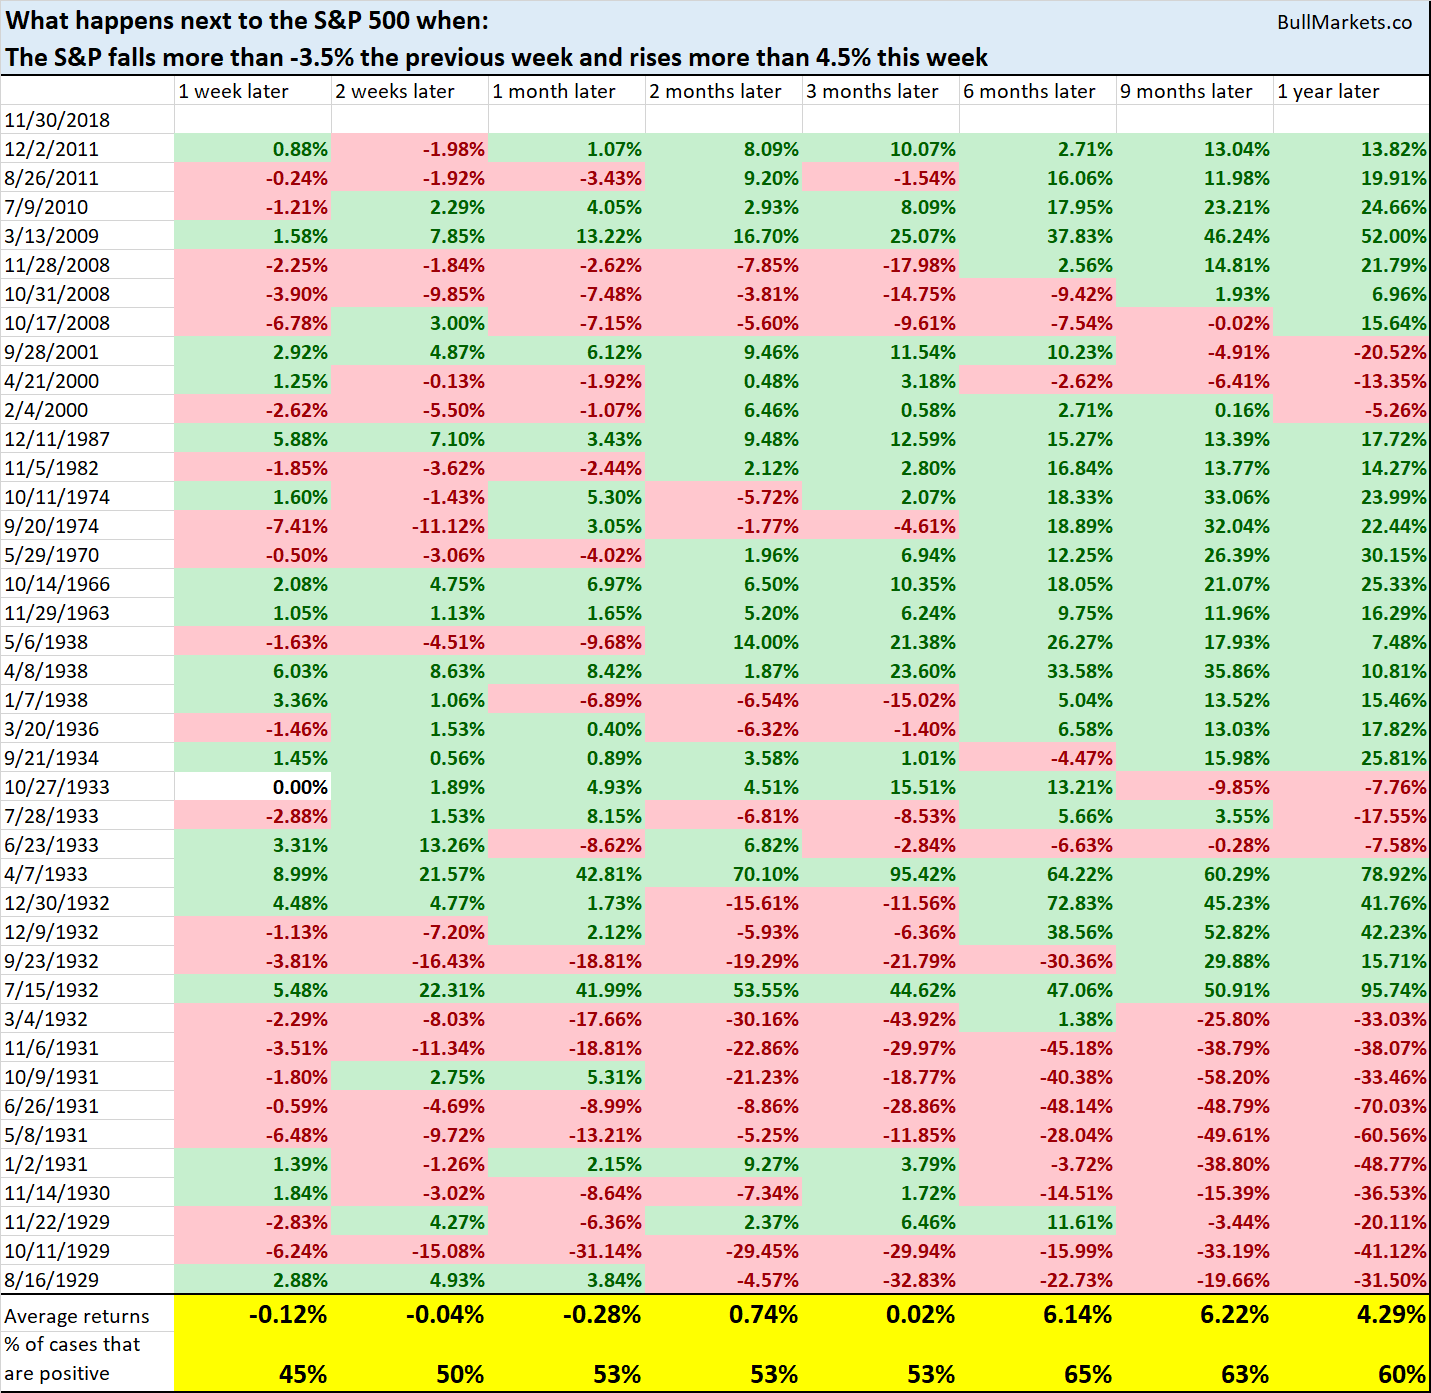
As you can see, the stock market’s forward returns are random.
HOWEVER, this study fails to take context into consideration. Big reversals are common in bear markets, AFTER the stock market has tanked -30%. This is because bear markets are marked by large short term swings.
Let’s narrow down the cases to those that are within 10% of a 2 year high (i.e. right now)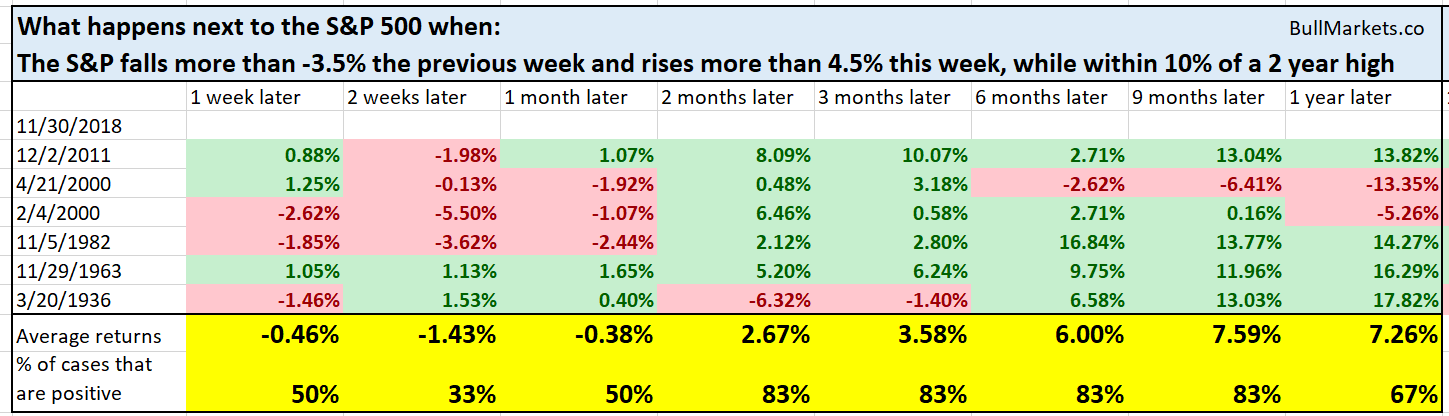
Once again, you can see that the stock market does well over the next 6-9 months, after which forward returns deteriorate. Even the two 2000 cases (February 2000 and April 2000) saw the stock market do well over the next 3 months.
Utilities Select Sector SPDR (NYSE:XLU) and Consumer Staples Select Sector SPDR (NYSE:XLP)
CNBC had Erin Gibbs on. He’s a portfolio manager at S& Global Market Intelligence. While the stock market has fallen over the past 2 months, XLU (utilities sector) and XLP (consumer staples) have gone up. According to Gibbs, this is good for the stock market.
It isn’t.
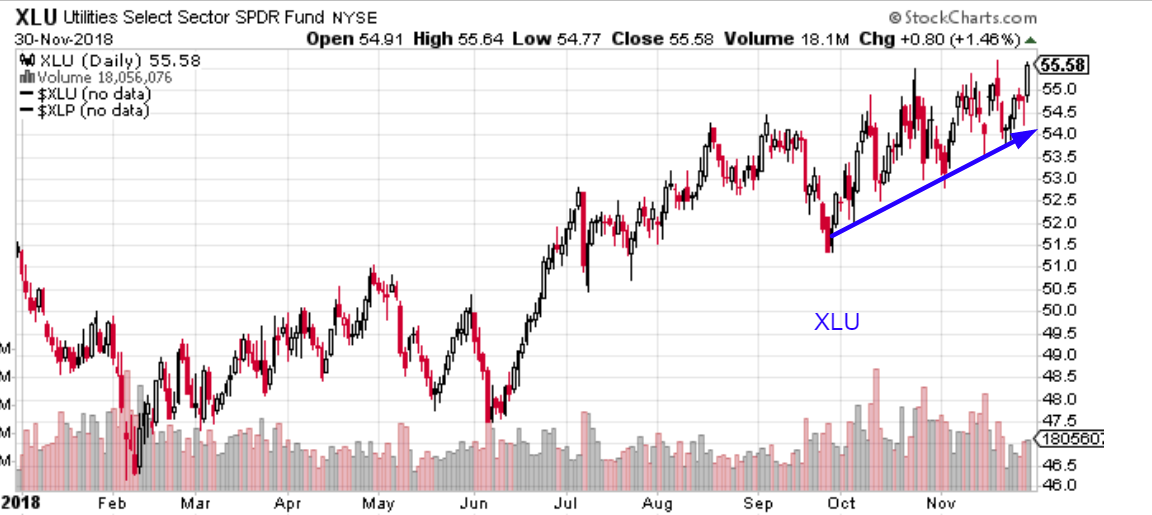
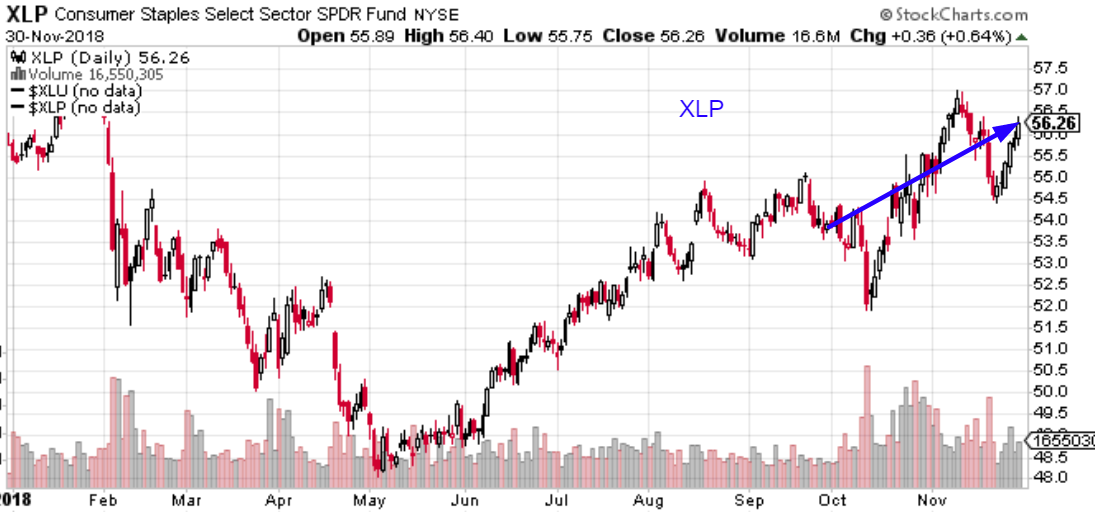
XLU and XLP are defensive sectors. When defensive sectors MASSIVELY outperform, that is a long term bearish sign for the stock market.
From 1998 – present, here are the cases when the S&P fell more than -5% over the past 2 months, while XLP and XLU rose more than +4%.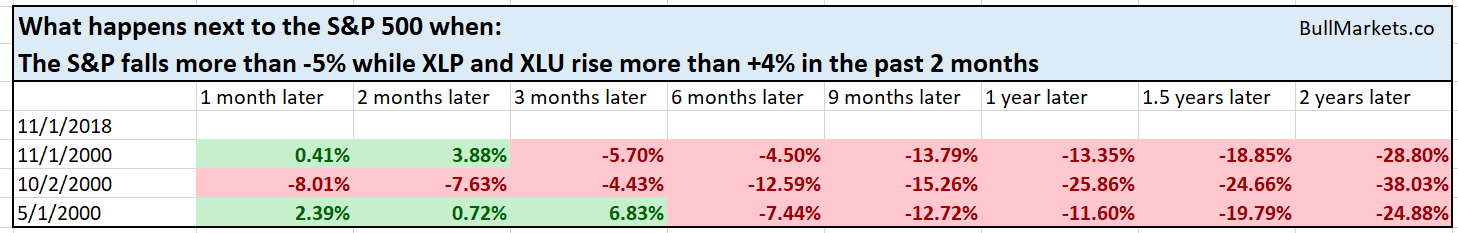
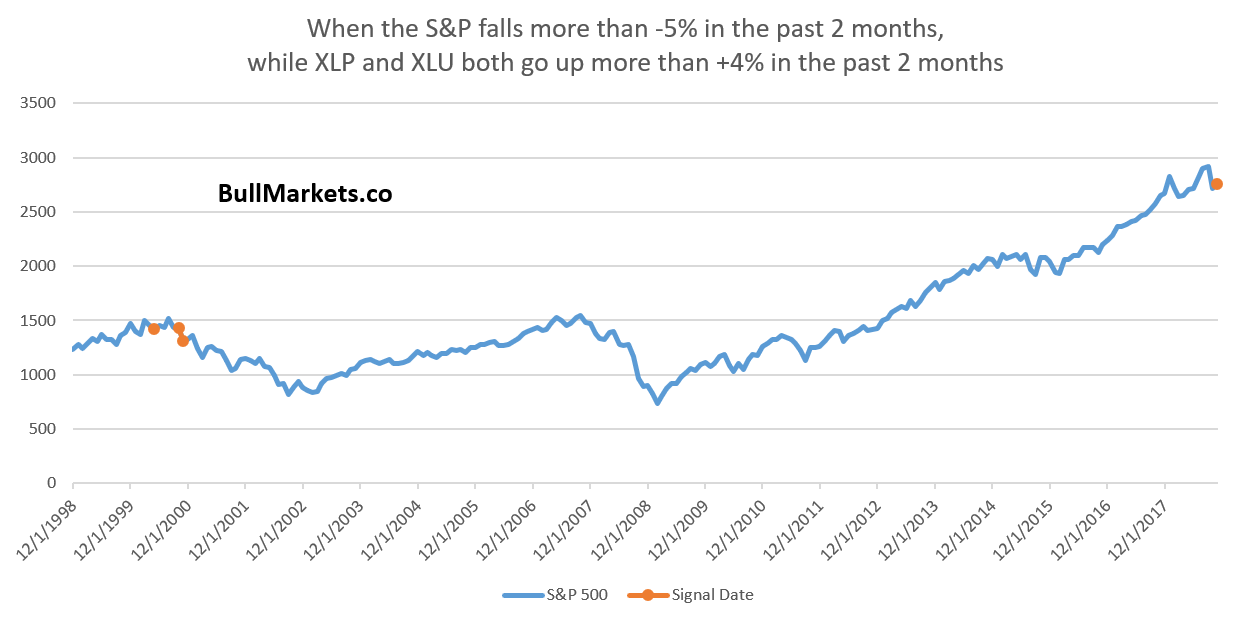
As you can see, the first case in the 1990s bull market was May 2000. The stock market did well over the next 3-4 months, after which it entered into a bear market.
Click here to see yesterday’s market study
Conclusion
Our discretionary technical outlook remains the same:
- The current bull market will peak sometime in Q2 2019. Then a bear market will ensue. We are in a long term topping process. Tops are a process, not an event.
- The medium term remains bullish (i.e. approximately next half year).
- The short-medium term is mostly a 50-50 bet.
We focus on the medium term and long term. We mostly ignore the short term, which is usually just noise.