The precious-metals sector is enduring losses for the third straight week. The gold miners and silver have led the way down, though silver has rallied over the past two sessions. Gold has also rallied yet remains dangerously close to making a new weekly low for the bear market. While the metals recovered some losses on Wednesday and Thursday, the gold miners failed to generate anything positive and closed near their lows for each session. The inability of the miners to recover to even a small degree augurs badly for the entire sector in the days ahead.
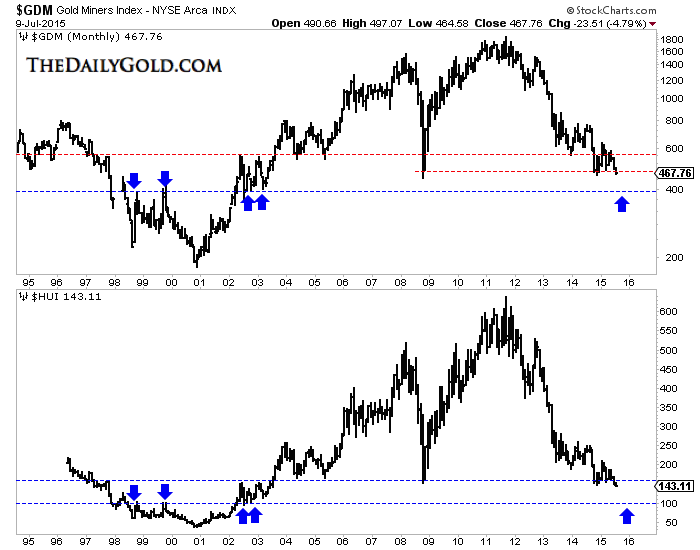
Continued weakness in the miners is not much of a surprise considering they are breaking down from their 2008 and 2014 lows. We plot monthly bars below for GDM (forerunner to (ARCA:GDX)) and the HUI. GDM closed at 468 and lacks strong support until 400. The HUI is in full blown breakdown mode and does not have strong support until the low 100s.
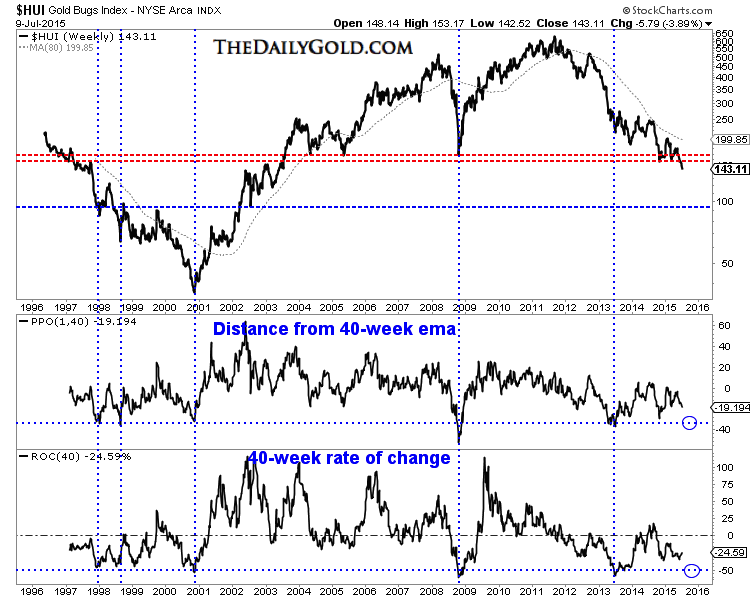
In the chart below we plot the HUI’s weekly price going back 20 years and two oscillators which can serve as overbought and oversold indicators. We plot the HUI’s distance from its 40-week exponential moving average and its rolling 40-week rate of change. The HUI is certainly oversold but these two oscillators argue the HUI is some distance from reaching the extreme oversold condition seen in spring 2013, late 2008 and late 2000.
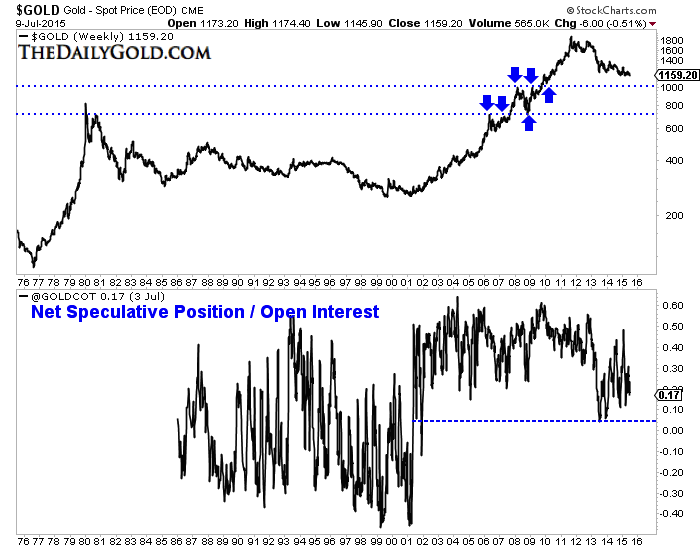
Turning to Gold, it appears ripe for a breakdown below $1150/oz in the days ahead. If that comes to pass, then the focus should be on its next strong support around $1000/oz to $1040/oz. The chart below includes the weekly plot of Gold as well as the net speculative position as a percentage of open interest. The net speculative position will be updated Friday and figures to be close to 10%. In our view that needs to go below 5% (the 2013 low) for sentiment to be considered extreme. A reading below 5% would mark a 14-year low.
We appear to be in the early stages of the final act in this precious metals bear market. Gold breaking below $1140-$1150/oz could put us in the middle stages. Our work shows that miners are not yet extremely oversold and have room to fall before reaching strong support. Gold breaking below $1150/oz and then $1100/oz would initiate further losses in the miners and bring them very close to that extreme oversold condition. It is the combination of an extreme oversold condition coupled with strong technical support that creates a very favorable buying opportunity.
A few weeks ago we noted that it was potentially a very dangerous time for bulls. It still its. However, the closer the miners get to extremely oversold and the closer Gold is to $1000/oz then the closer we are to risk favoring the bulls. It is always darkest before dawn. At somepoint within a few months, the switch will flip and we could have some epic buying opportunities in the precious metals complex.


