Get 40% Off
🚀 AI-picked stocks soar in May. PRFT is +55%—in just 16 days! Don’t miss June’s top picks.Unlock full list

Monthly/Weekly/Daily Cycles Of 6 Major Indices

Published 10/24/2012, 12:57 AM
Updated 07/09/2023, 06:31 AM
RED
-
NOTE
-
CTPC
-

Looking at a top-down view of the 6 Major Indices, I would note the following.

Monthly View

  • all just below the top of their recent highs
  • Stochastics indicator is in overbought territory, except for DJT & DJU which is neutral
  • major support is at the bottom Bollinger Band, which, generally, lies in the vicinity of the Monthly 50 sma (red)
  • while the 50 sma is still (just) above the 200 sma on the SPX, it has recently crossed below on the ES, so it's now officially under the bearish influences of a "Death Cross" formation on the Monthly timeframe
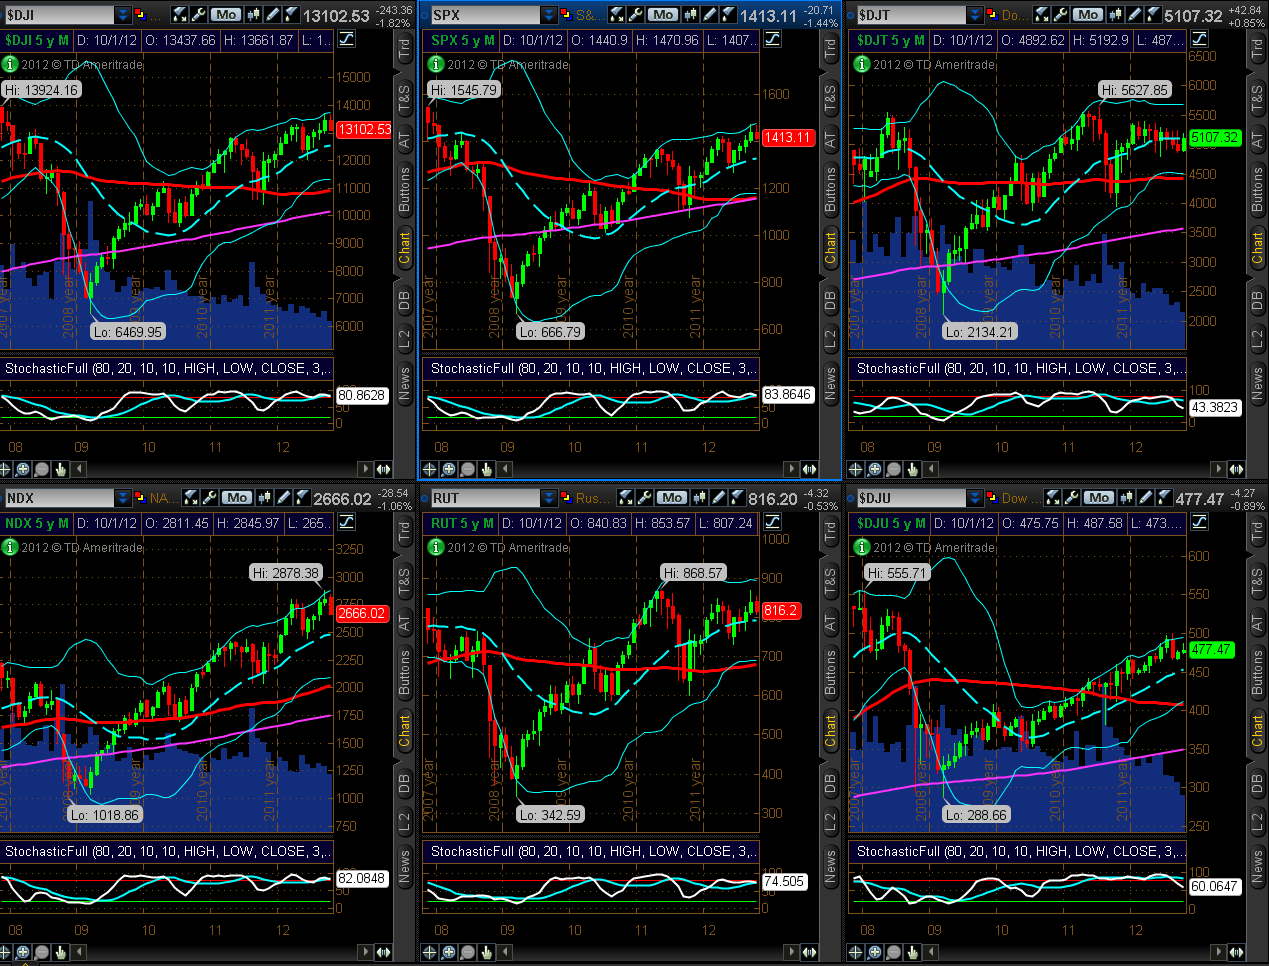

Chart 1
Weekly View
  • all at/near their mid-Bollinger Band
  • Stochastics indicator is not yet in oversold territory on 5 of the Indices...NDX is now oversold
  • major support sits around the vicinity of the Weekly 50 sma (red)
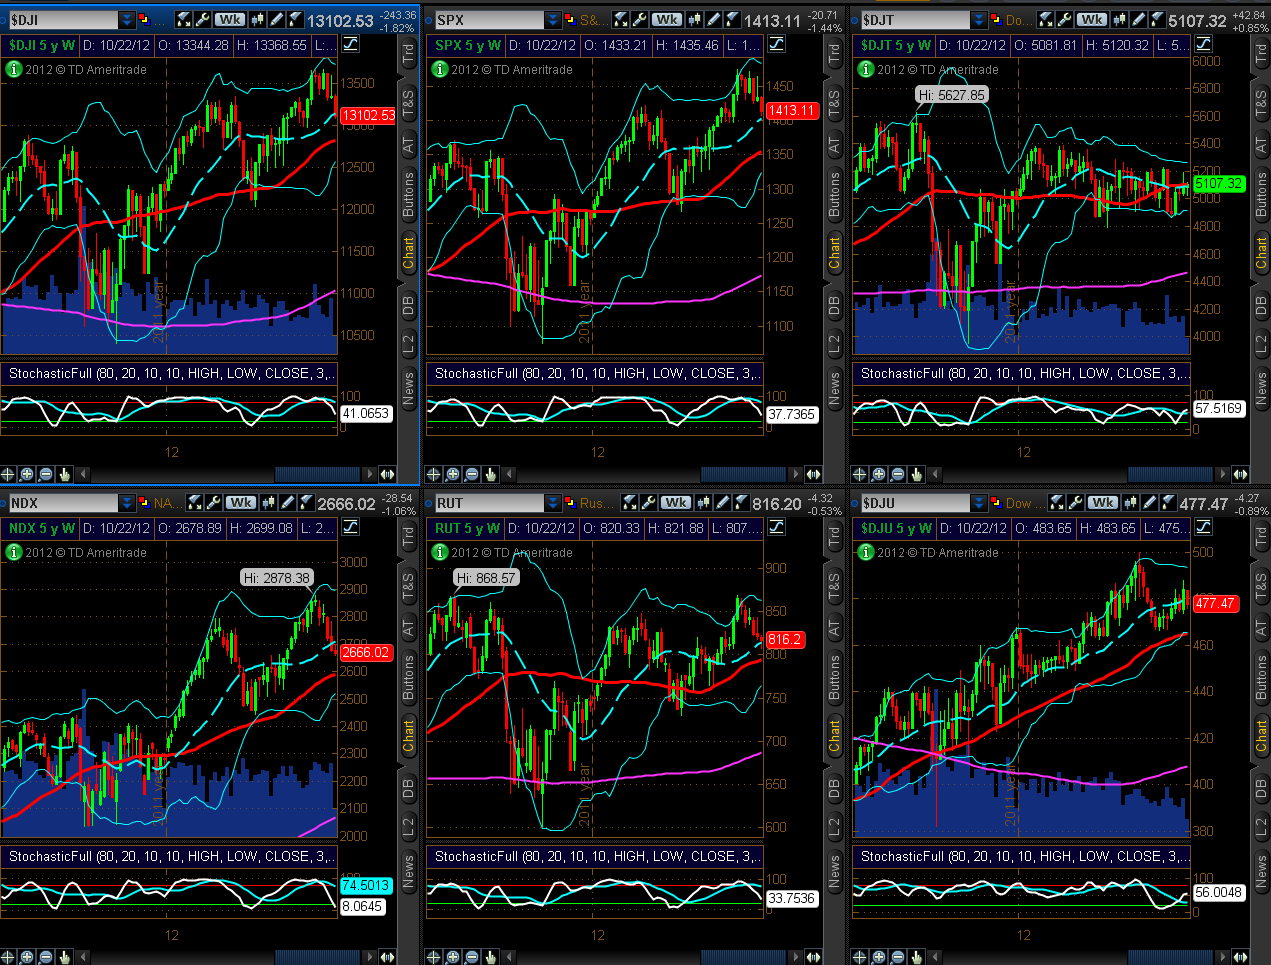
Chart 2
Daily View
  • DJI, SPX, NDX & RUT are at/below their lower Bollinger Band
  • DJT is in between its upper and mid-Bollinger Band
  • DJU is just below its mid-Bollinger Band
  • Stochastics indicator is in oversold territory on DJI, SPX, NDX & RUT
  • DJT & DJU are neither overbought nor oversold
  • major support sits at the Monthly 200 sma (pink
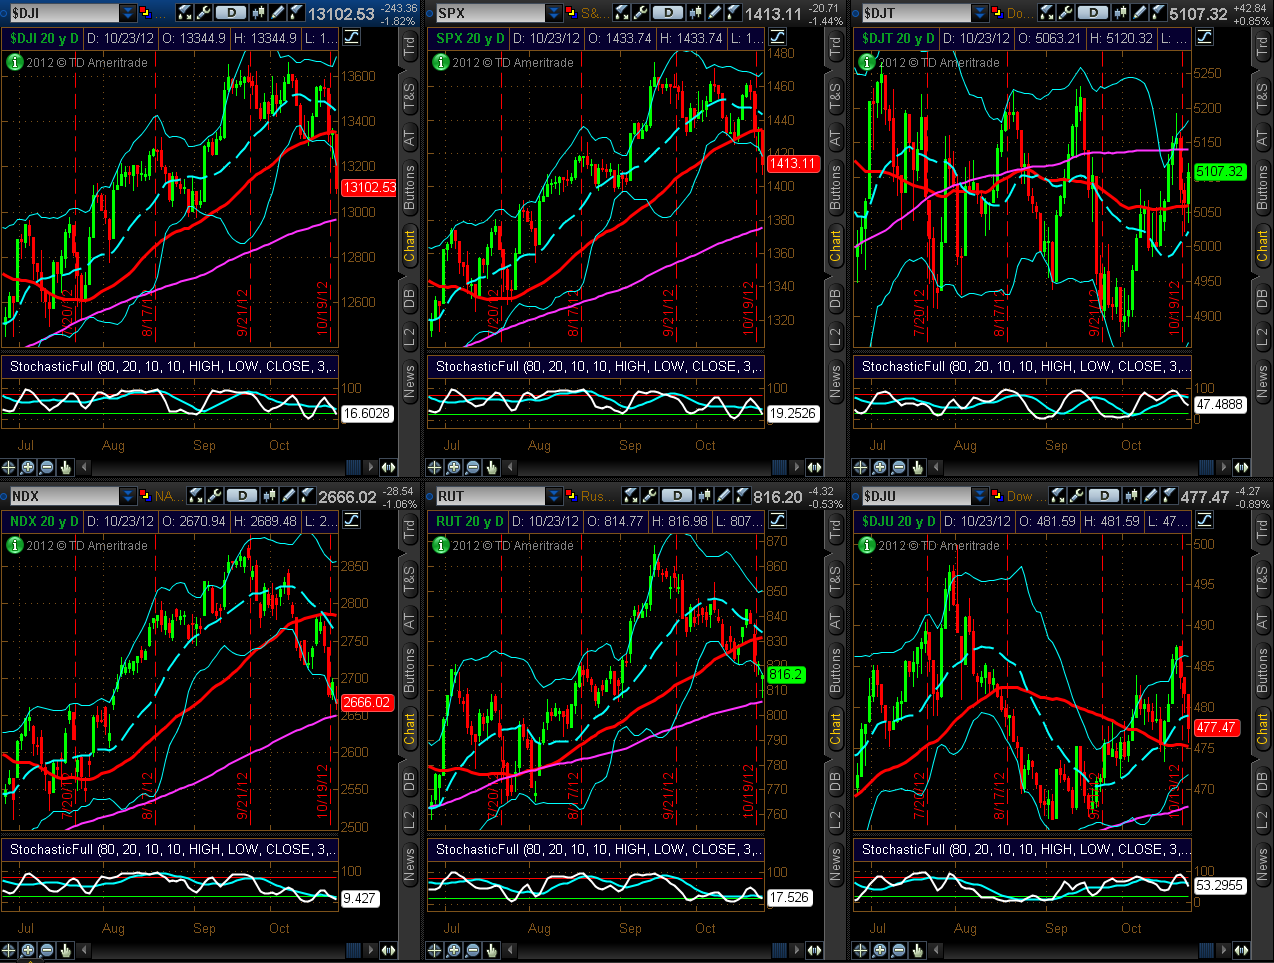
Chart 3

In the short term, we may see a bit of a bounce, but medium and longer term, these Indices may continue their downward trek to alleviate their overbought conditions on their Weekly and Monthly timeframes.

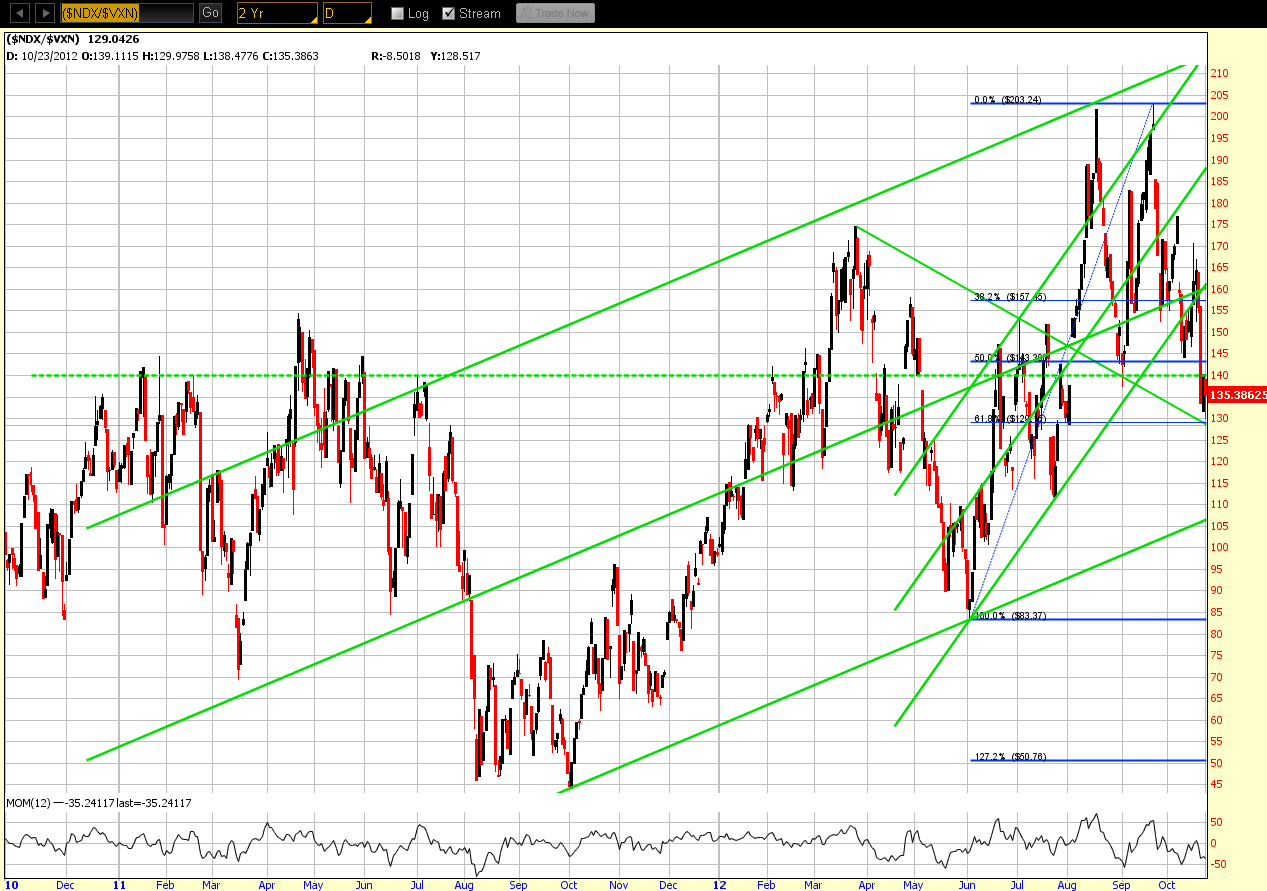
The following ratio charts comparing the SPX, the RUT, and the NDX to their respective Volatility Indices show that, while a lower swing low has now been made and the Momentum Indicator (MOM) is below the zero level, each one is sitting at or just above a support level on the Daily timeframe. Increasing volatility will confirm any further selling in these 3 Indices. Of particular interest is the fact that MOM has made a lower swing low on the SPX:VIX to confirm the lower low on price, whereas it has not on the RUT:RVX and NDX:VXN...suggesting that today's (Tuesday's) selling momentum on the SPX accelerated at a greater pace than on the RUT & NDX...ones to watch during any further pullback to confirm an acceleration of the selling momentum.
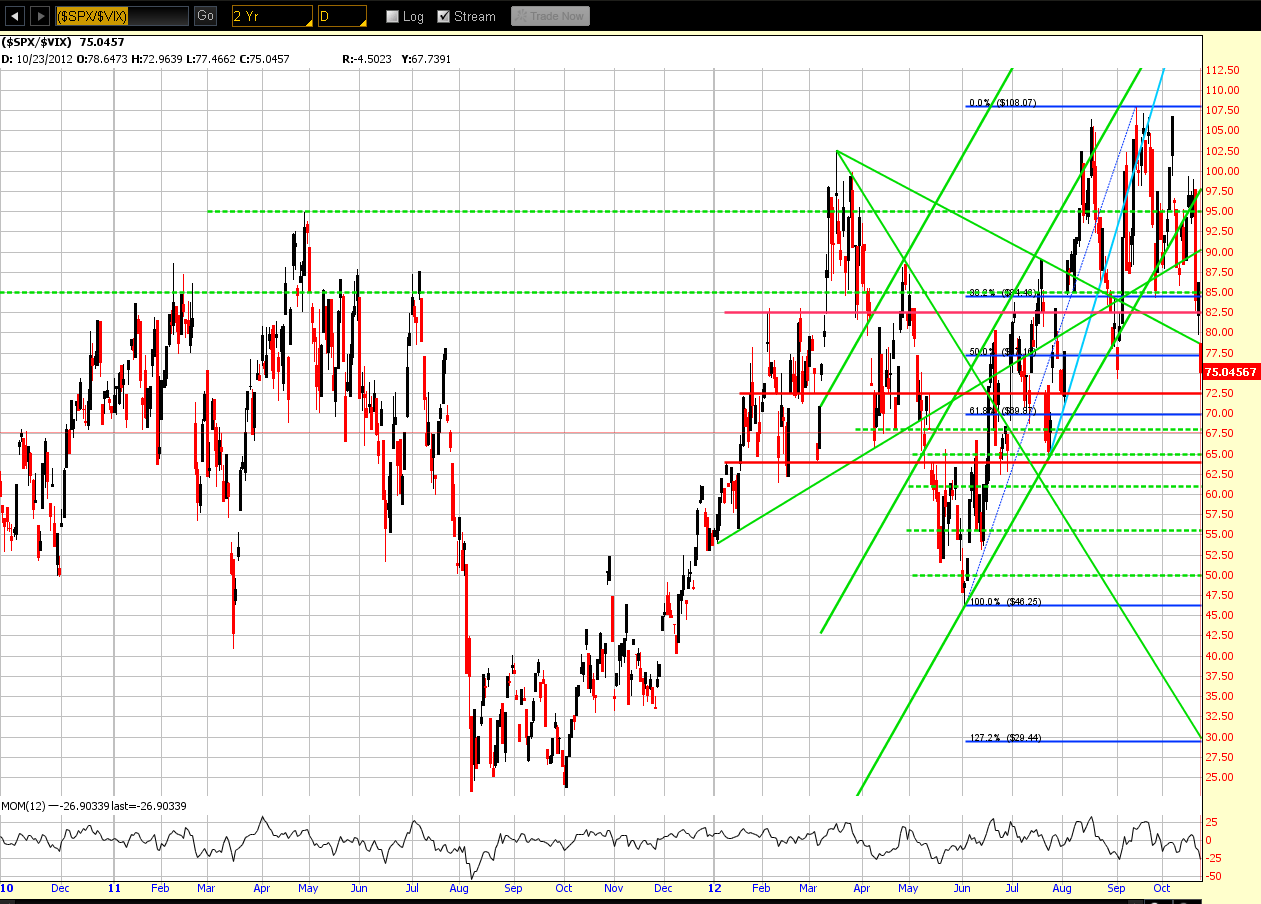
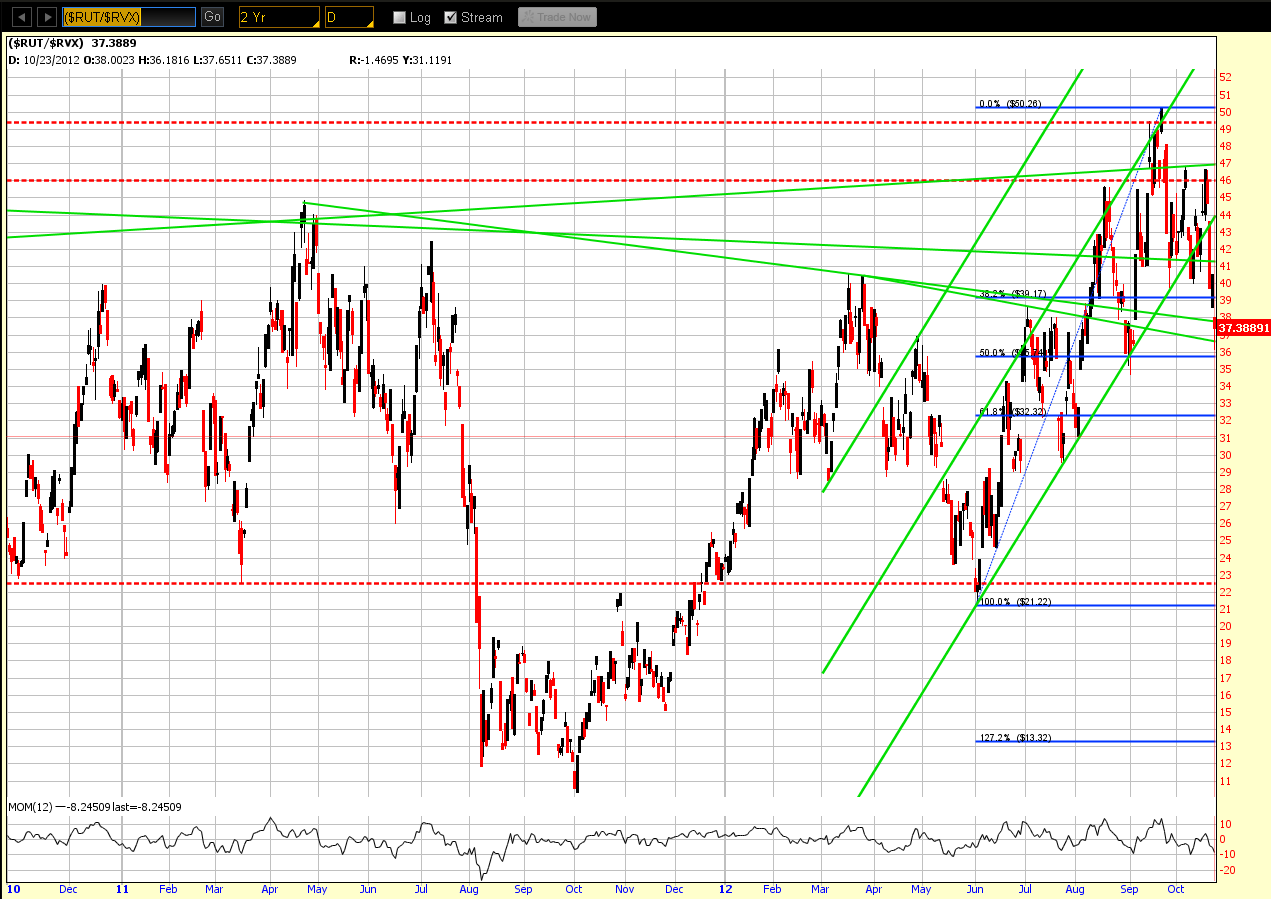
Chart 4

Chart 5

Chart 6

Latest comments

Loading next article…
Risk Disclosure: Trading in financial instruments and/or cryptocurrencies involves high risks including the risk of losing some, or all, of your investment amount, and may not be suitable for all investors. Prices of cryptocurrencies are extremely volatile and may be affected by external factors such as financial, regulatory or political events. Trading on margin increases the financial risks.
Before deciding to trade in financial instrument or cryptocurrencies you should be fully informed of the risks and costs associated with trading the financial markets, carefully consider your investment objectives, level of experience, and risk appetite, and seek professional advice where needed.
Fusion Media would like to remind you that the data contained in this website is not necessarily real-time nor accurate. The data and prices on the website are not necessarily provided by any market or exchange, but may be provided by market makers, and so prices may not be accurate and may differ from the actual price at any given market, meaning prices are indicative and not appropriate for trading purposes. Fusion Media and any provider of the data contained in this website will not accept liability for any loss or damage as a result of your trading, or your reliance on the information contained within this website.
It is prohibited to use, store, reproduce, display, modify, transmit or distribute the data contained in this website without the explicit prior written permission of Fusion Media and/or the data provider. All intellectual property rights are reserved by the providers and/or the exchange providing the data contained in this website.
Fusion Media may be compensated by the advertisers that appear on the website, based on your interaction with the advertisements or advertisers.
© 2007-2024 - Fusion Media Limited. All Rights Reserved.