It is going to be a busy week for economic data. Most of this data’s focus will be around inflation and economic recovery.
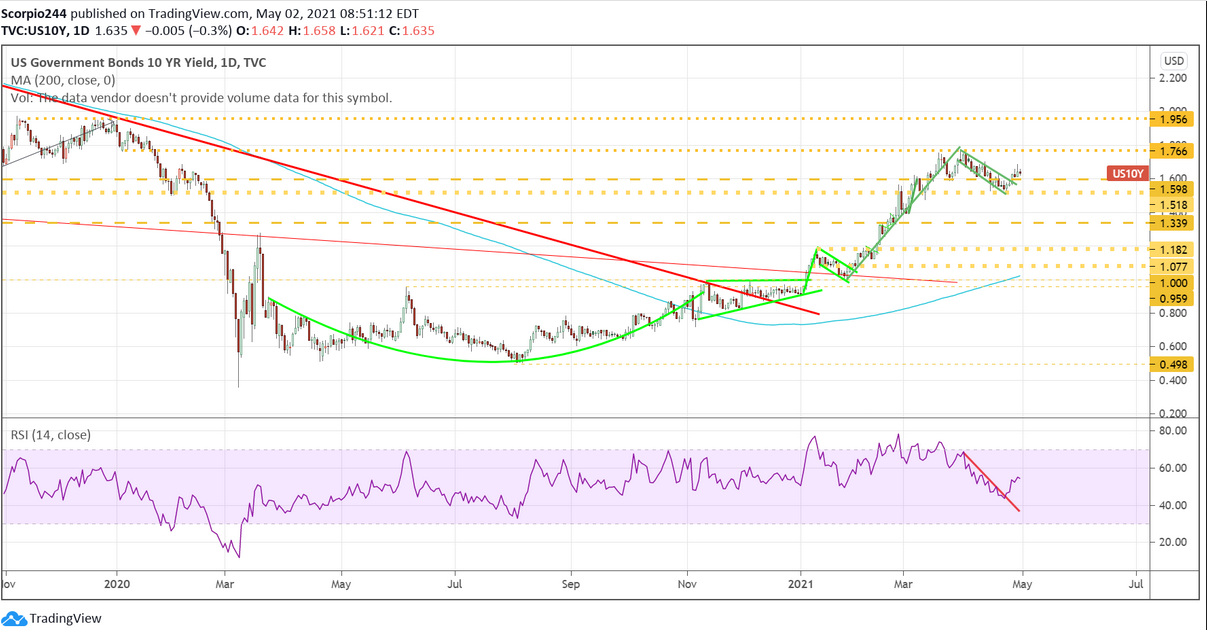
Bond yields seemed to be positioned for higher than expected inflation, which means they are likely to rise. The 10-year has recently broken out of a bull flag pattern and seems more than ready to head up toward 2%.
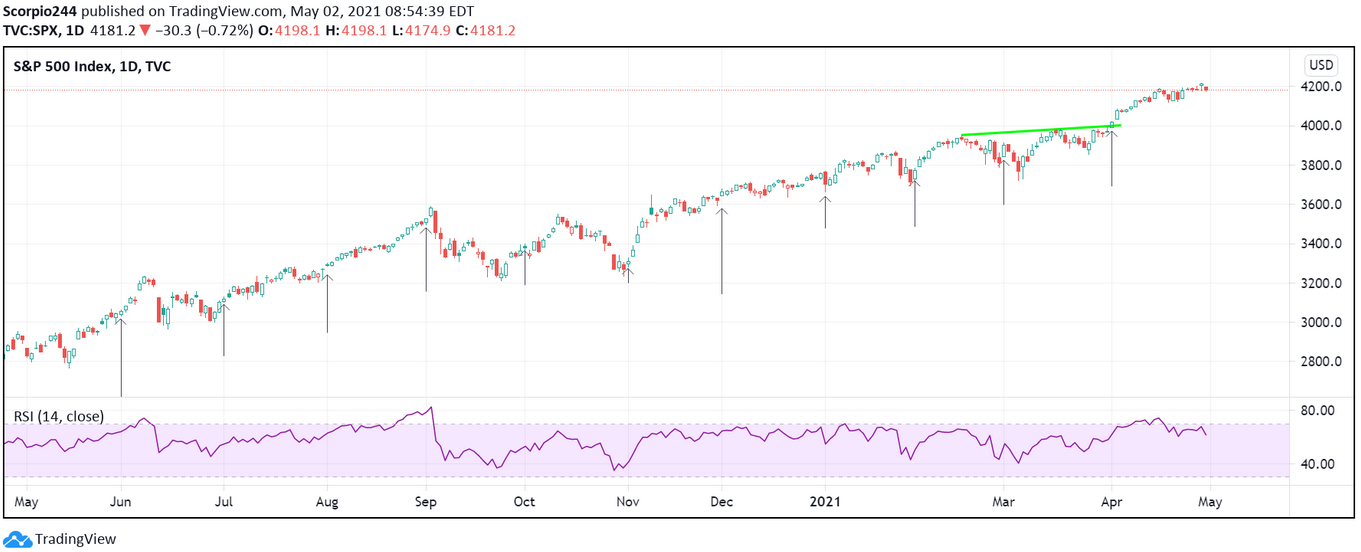
A push of 2% will create issues for growth stocks and eventually for the entire market. Even though today is likely to be another of 1%er days, as it’s the first trading day of May, and the first day of every month has been strong.
But of course, now that I’m pointing this, the S&P 500 will probably be down 2% on Monday. I’m joking. I have no idea what will happen, but you can see that it is pretty hard to miss the strong monthly inflows on the first day of every month on the chart below. Of course, if we're down today, it would probably not be a good sign.
S&P 500
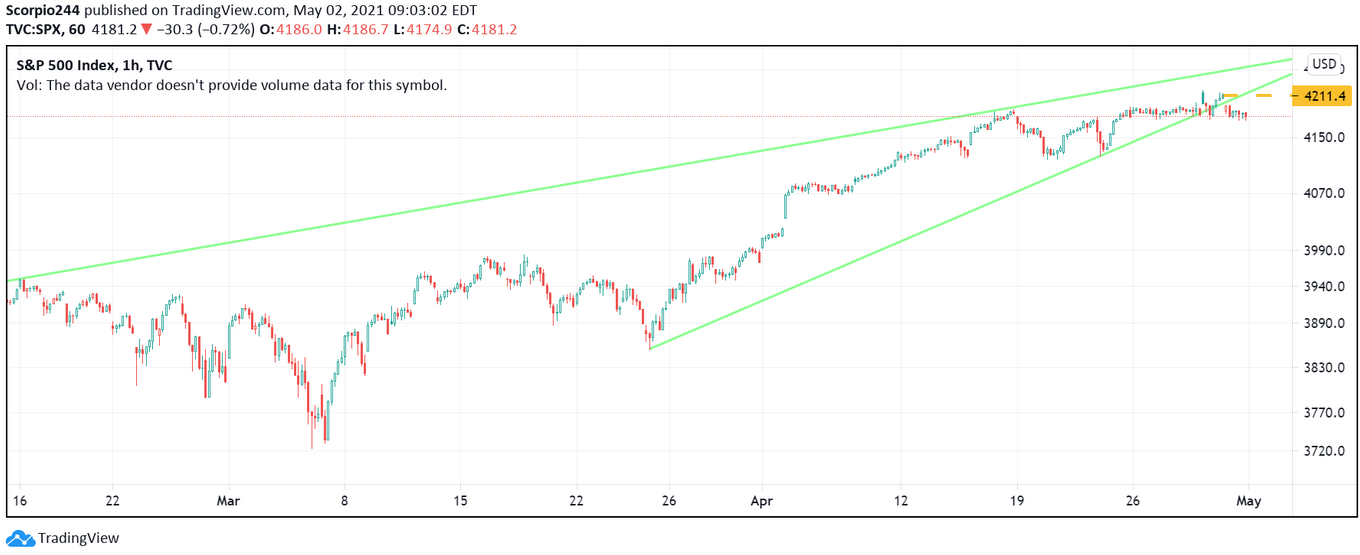
The index did break down on Friday, falling out a rising wedge pattern, and that is a bearish sign. However, there is a gap to fill, and a retest of the breakdown is needed. So at least for Monday, I think there is a good chance the index rallies and closes the gap at 4,210 and likely falls from there, completing the rising wedge pattern and starting a corrective phase.
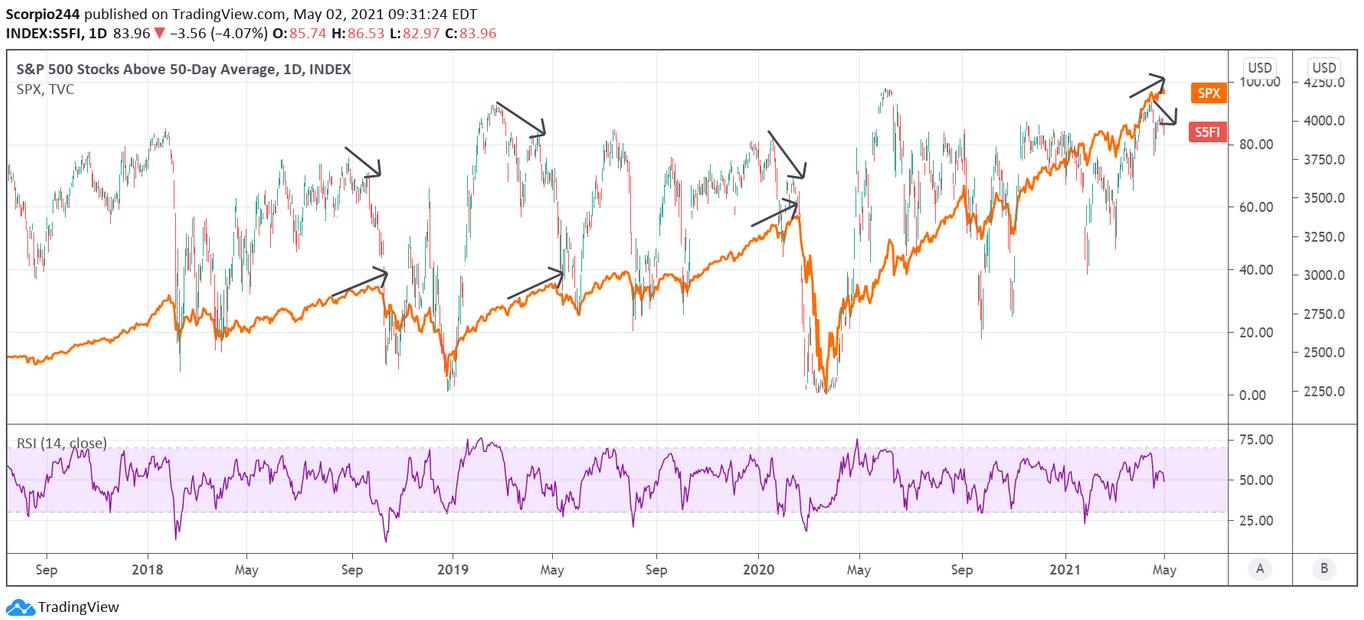
This chart may also be telling us that something in the market is not looking strong. In the past, every time we have seen a divergence in the percentage of stocks above their 50-day moving average and the S&P 500, it has led to a sell-off in the index. We can clearly see that the number of stocks in the S&P 500 and diverging again, probably not a good sign of things to come.
Amazon
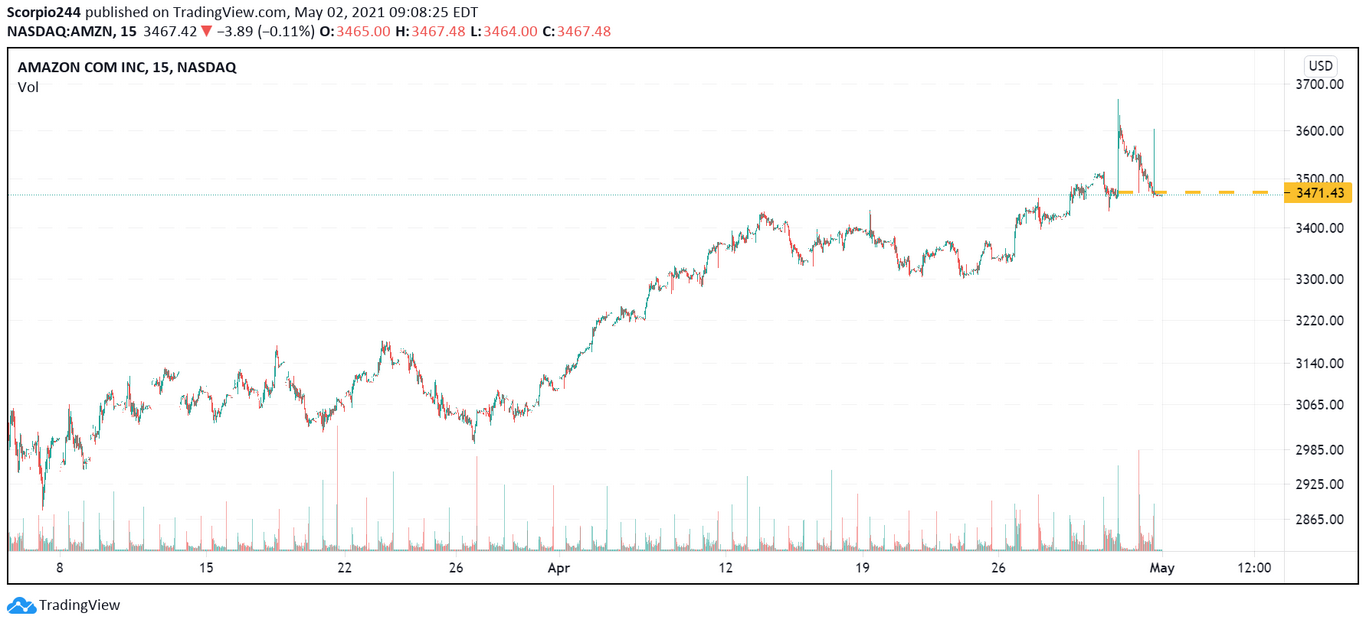
Amazon.com (NASDAQ:AMZN) reported excellent results on Thursday night, but it wasn’t good enough to push the stock higher. In fact, the stock finished down on Friday.
The stock was down more than 5% from its Thursday Afterhours highs, and I would call that a pretty significant reversal. Now maybe it was a gap fill; maybe it wasn’t. But I feel this was more than a gap-fill since the stock actually closed down on Friday, surpassing the gap, with it happening in the final hour of trading.
Apple
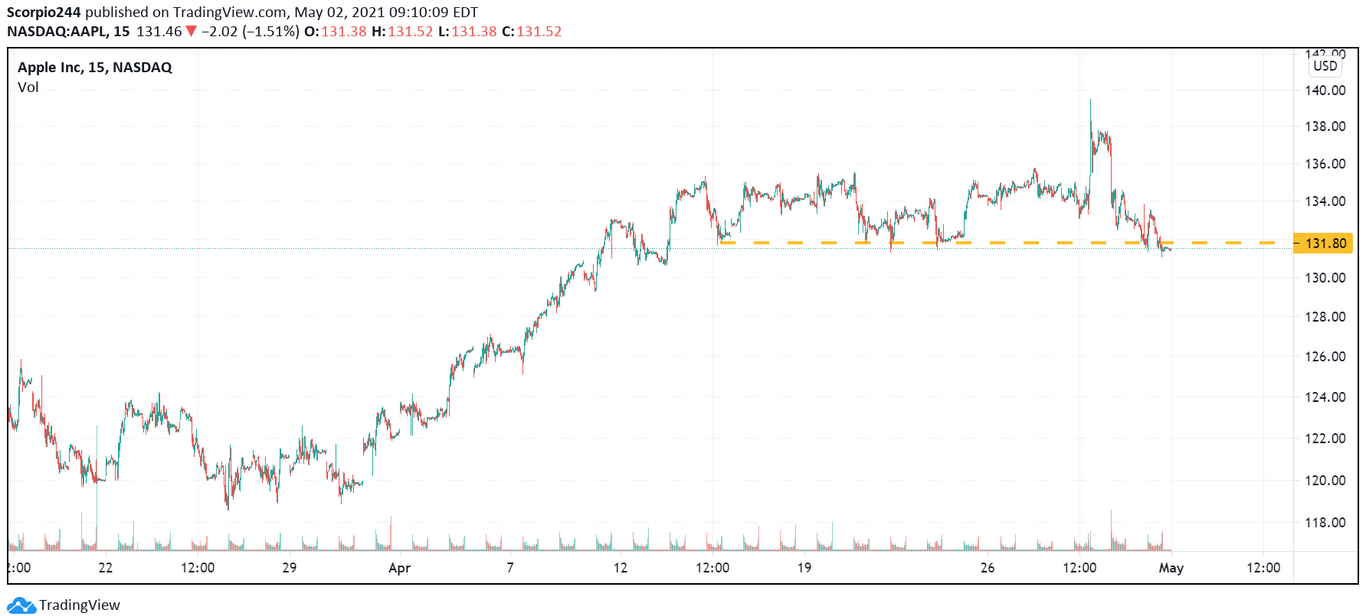
Hey, nobody is trying to knock Amazon. They did the same thing for Apple (NASDAQ:AAPL), and I have owned Apple for years, and I think Airtags are the coolest thing. I already pre-ordered mine. I could easily see myself having several of them because I lose everything.
These stocks are tired, and even though they have consolidated for months, their valuations are still high, and all of this good news was expected and is why their valuation is high. So now they need some time to have their earnings catch up to their valuation.
So that means they keep trading sideways, or they correct. I prefer a correction to get it over with it, then dragging on sideways price action for the next several months.
Advanced Micro Devices
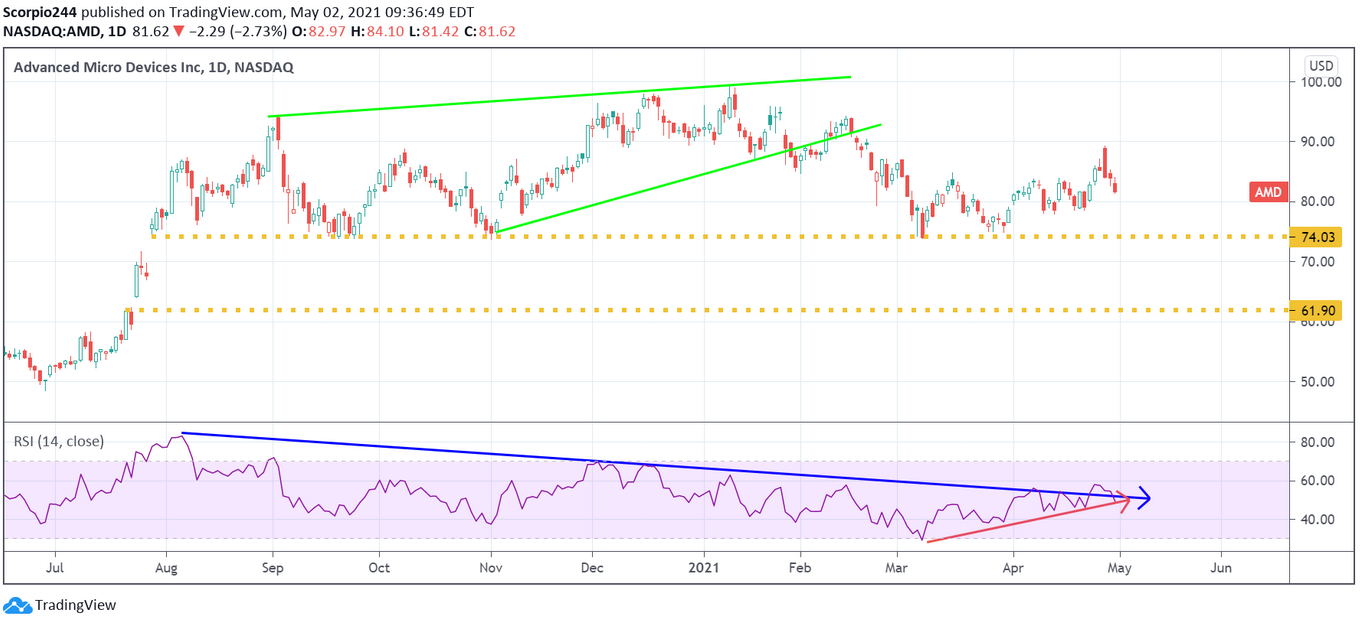
The same thing happened to AMD, too, after great results. They don’t matter presently. There remains a very overwhelming downtrend in the RSI, which does not bode well for the stock.
