Get 40% Off
💰 Buffett reveals a $6.7B stake in Chubb. Copy the full portfolio for FREE with InvestingPro’s Stock Ideas toolCopy Portfolios

Money Flow: February, Week 2

Published 02/17/2013, 01:49 AM
Updated 07/09/2023, 06:31 AM
NDX
-
US2000
-
IFNC
-
RED
-
CTPC
-

Further to my last Weekly Market update, this week's update will look at:

  • 6 Major Indices
  • 9 Major Sectors
  • 30-Year Bonds
  • U.S. $
6 Major Indices

As shown on the Weekly charts and 1-Week percentage gained/lost graph below of the Major Indices, the largest gains were made in the Russell 2000, followed by the Dow Transports. The S&P 500 and Dow 30 were, essentially, flat, and there were minor losses in the Dow Utilities and Nasdaq 100.
As I mentioned last week, I was going to be watching to see if the Nasdaq and Utilities played catch-up...they didn't.
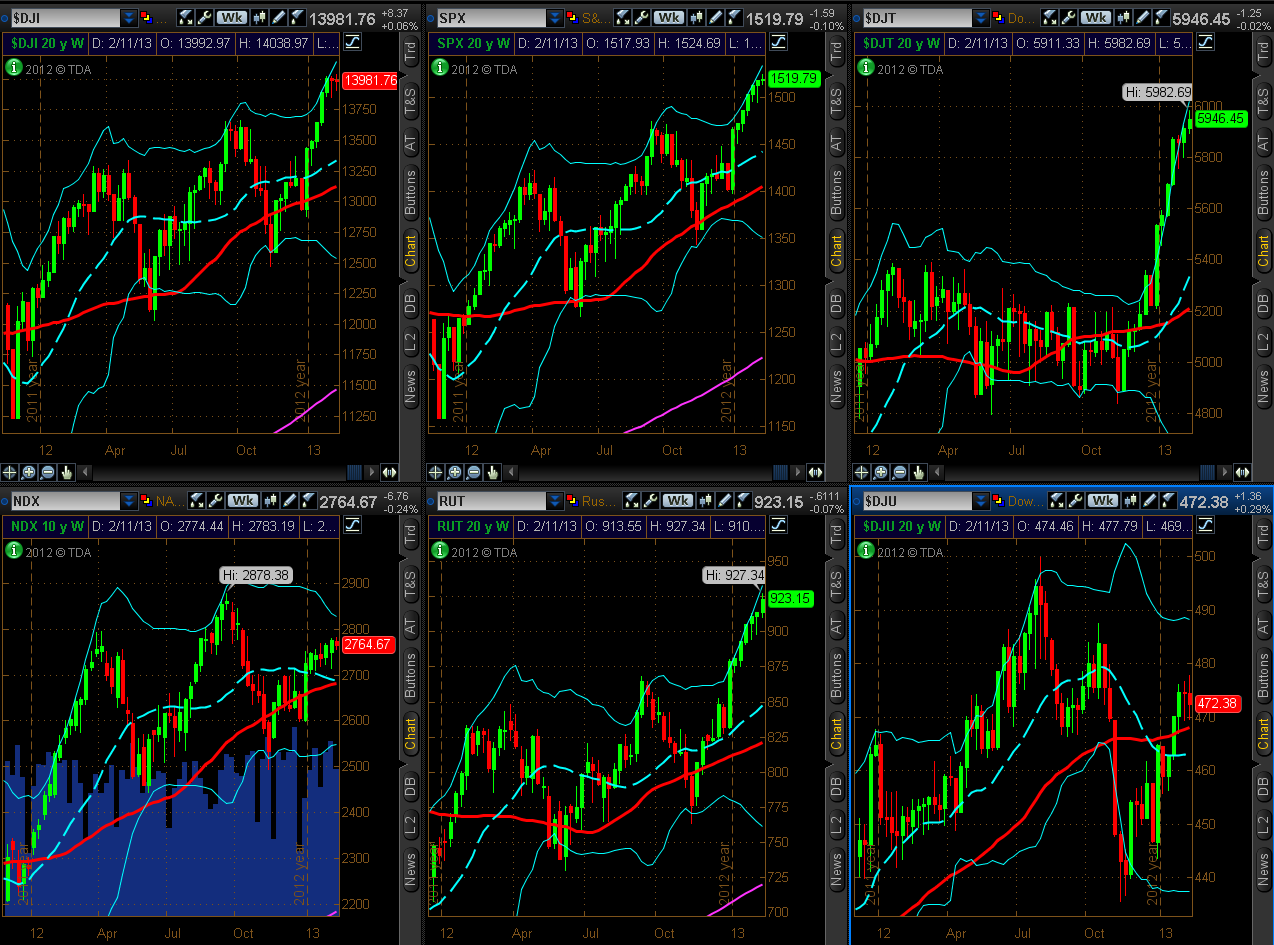
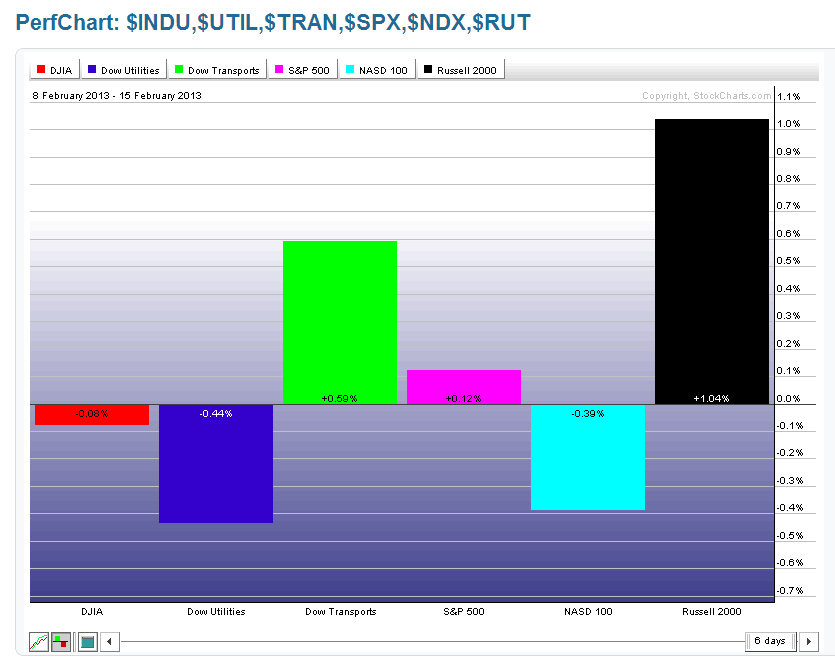
Chart 1

Chart 2
9 Major Sectors
As shown on the Weekly charts and 1-Week percentage gained/lost graph below of the Major Sectors, the largest gains were made in Industrials, Financials, Consumer Discretionary, and Consumer Staples. There were losses in Technology, while Materials, Energy, Health Care, and Utilities were, basically, flat.

These tell me that there was not much strength in the overall equity markets this past week...more of a pause in a lengthy (and, potentially, exhausted) uptrend.
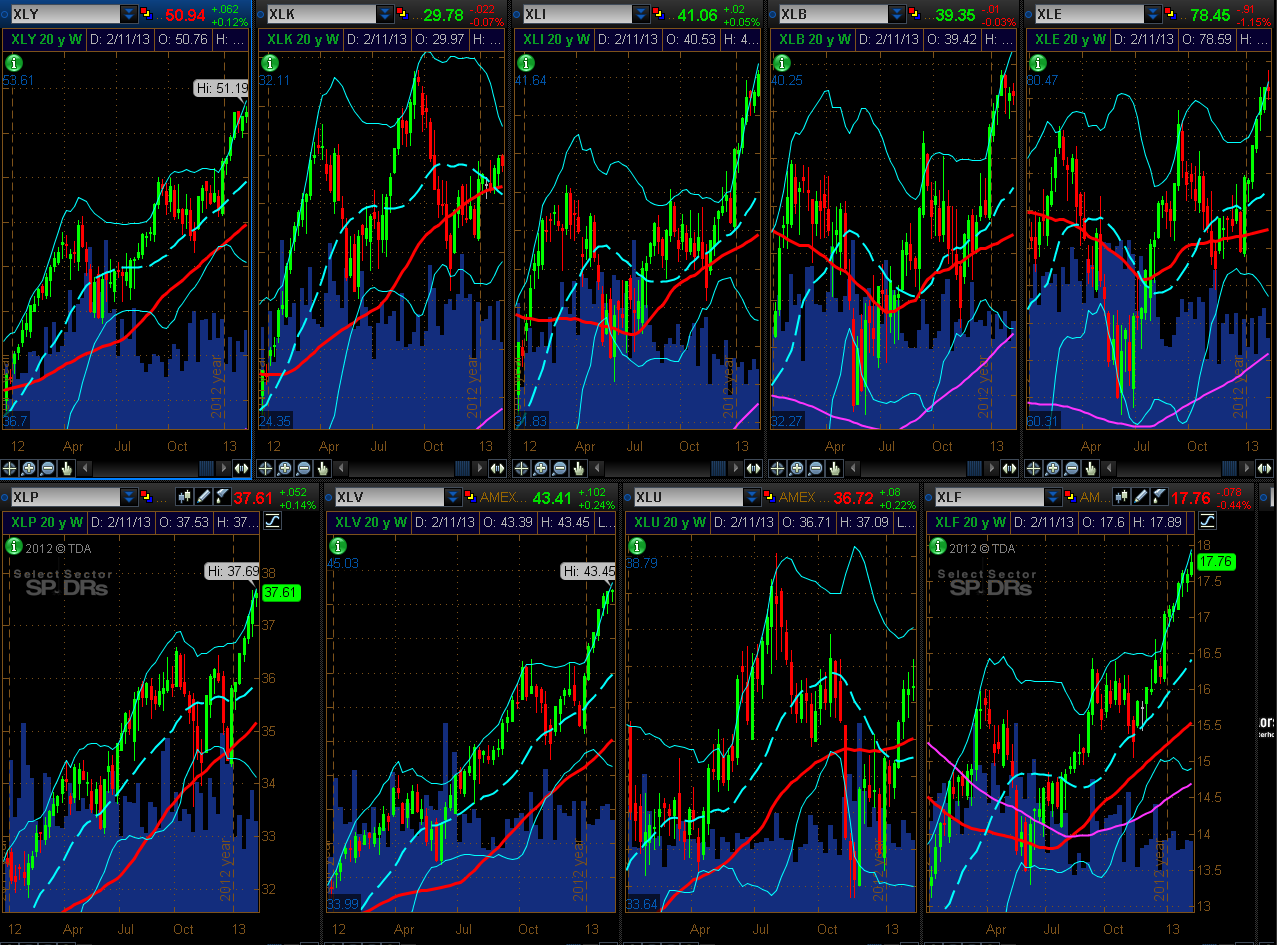
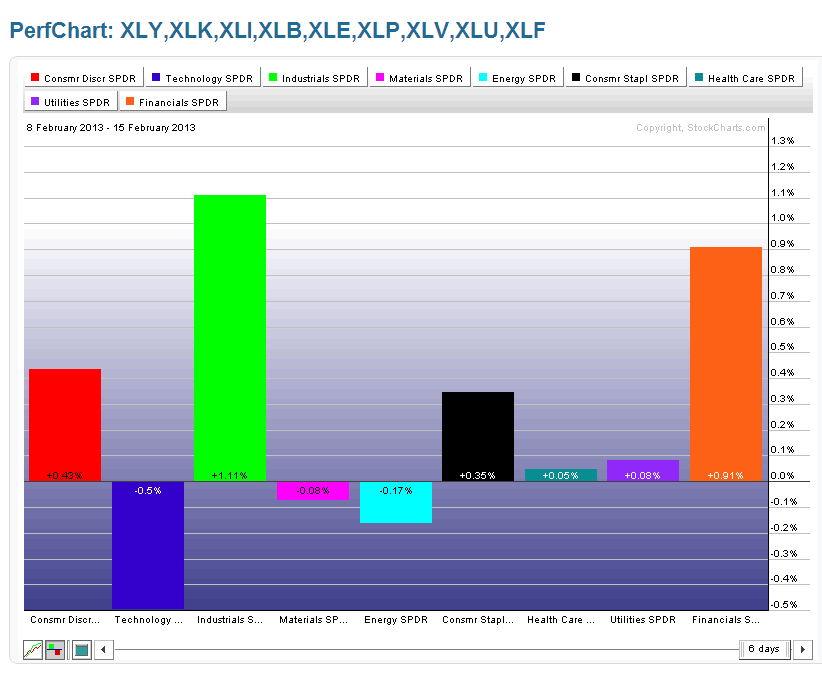
Chart 2

Chart 3
30-Year Bonds
Price closed slightly below last week's close, as shown on the 5-Year Weekly chart below of 30-Year Bonds. It remains just below major resistance. Despite the large volumes of the past few weeks, the drop below this resistance level has been small in comparison.
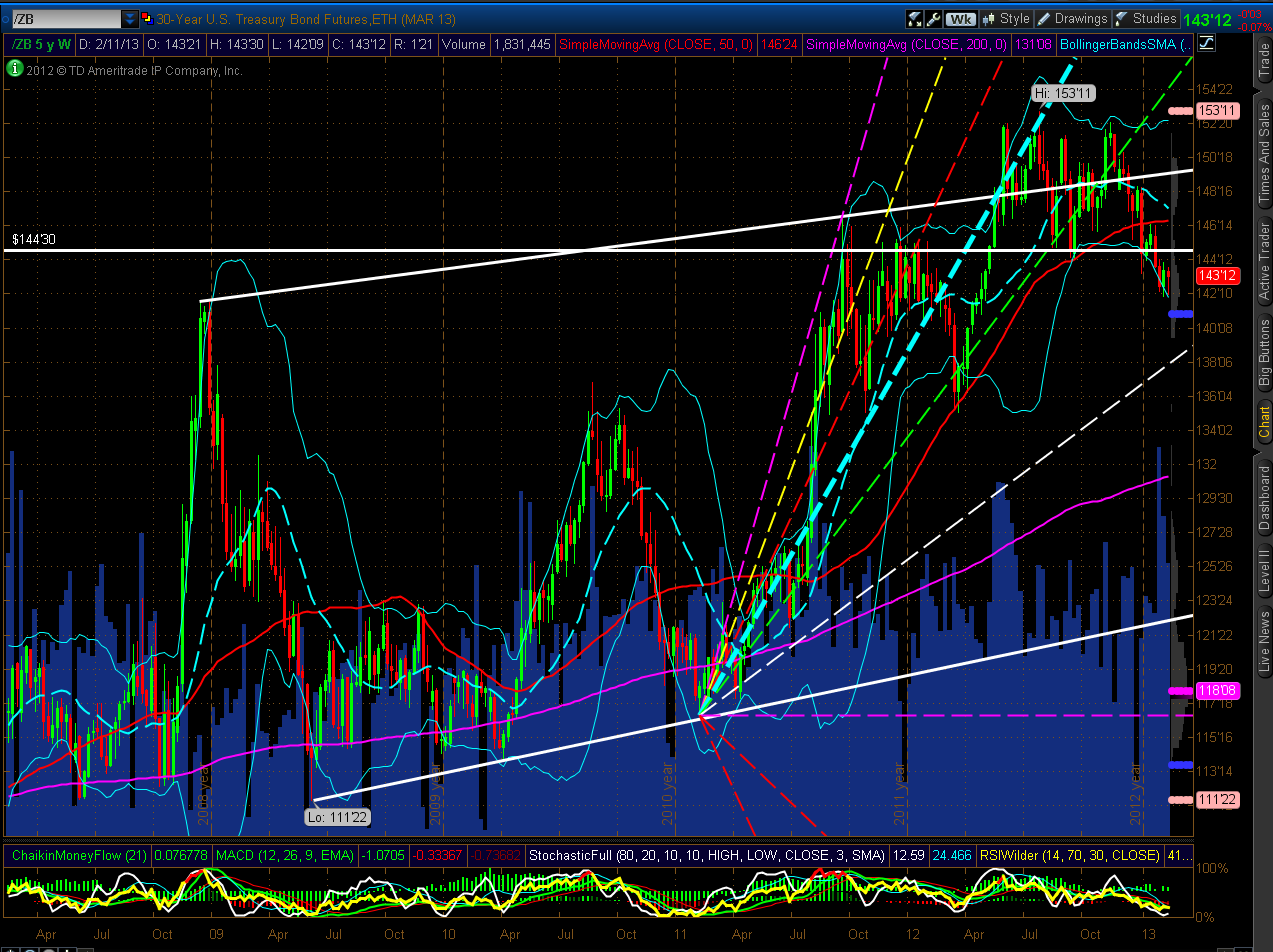
Chart 4
U.S. $
As shown on the 5-Year Weekly chart below of the U.S. $, price continued to rise this past week to close just below the 50 sma (red) and the 50% Fibonacci retracement level. A break and hold above this confluence resistance point may propel the dollar to 82.00, or higher.
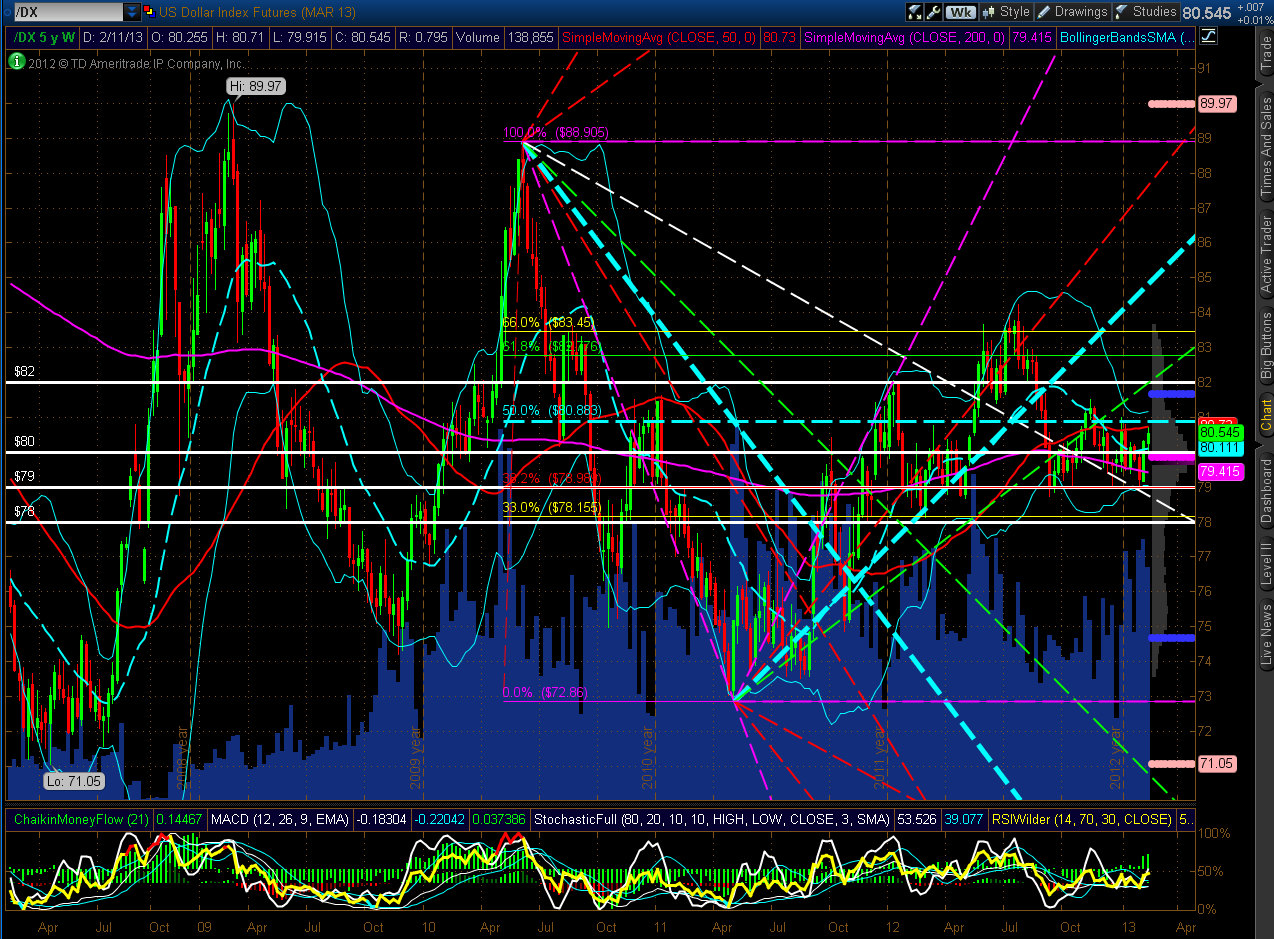
Chart 5
Summary

This is a short review, as not much happened in equities this past week.

Going forward, I'll be watching Technology, the U.S. $, and 30-Year Bonds, as discussed above, together with the 60 min trading ranges on the 4 Major E-mini Futures Indices and the Euro (as I discussed earlier in the week here) for possible negative or positive influences on the U.S. equity markets, BUT being mindful of this potential VIX scenario. We may also see hints of strength or weakness when trading resumes in China this coming week.

3rd party Ad. Not an offer or recommendation by Investing.com. See disclosure here or remove ads .

Latest comments

Risk Disclosure: Trading in financial instruments and/or cryptocurrencies involves high risks including the risk of losing some, or all, of your investment amount, and may not be suitable for all investors. Prices of cryptocurrencies are extremely volatile and may be affected by external factors such as financial, regulatory or political events. Trading on margin increases the financial risks.
Before deciding to trade in financial instrument or cryptocurrencies you should be fully informed of the risks and costs associated with trading the financial markets, carefully consider your investment objectives, level of experience, and risk appetite, and seek professional advice where needed.
Fusion Media would like to remind you that the data contained in this website is not necessarily real-time nor accurate. The data and prices on the website are not necessarily provided by any market or exchange, but may be provided by market makers, and so prices may not be accurate and may differ from the actual price at any given market, meaning prices are indicative and not appropriate for trading purposes. Fusion Media and any provider of the data contained in this website will not accept liability for any loss or damage as a result of your trading, or your reliance on the information contained within this website.
It is prohibited to use, store, reproduce, display, modify, transmit or distribute the data contained in this website without the explicit prior written permission of Fusion Media and/or the data provider. All intellectual property rights are reserved by the providers and/or the exchange providing the data contained in this website.
Fusion Media may be compensated by the advertisers that appear on the website, based on your interaction with the advertisements or advertisers.
© 2007-2024 - Fusion Media Limited. All Rights Reserved.