Further to my last Weekly Market Update, this week's update will look at:
- 6 Major Indices
- 9 Major Sectors
- Financial Stocks
- Social Media Stocks/ETF & BBRY
- 30-Year Bonds
- U.S. $
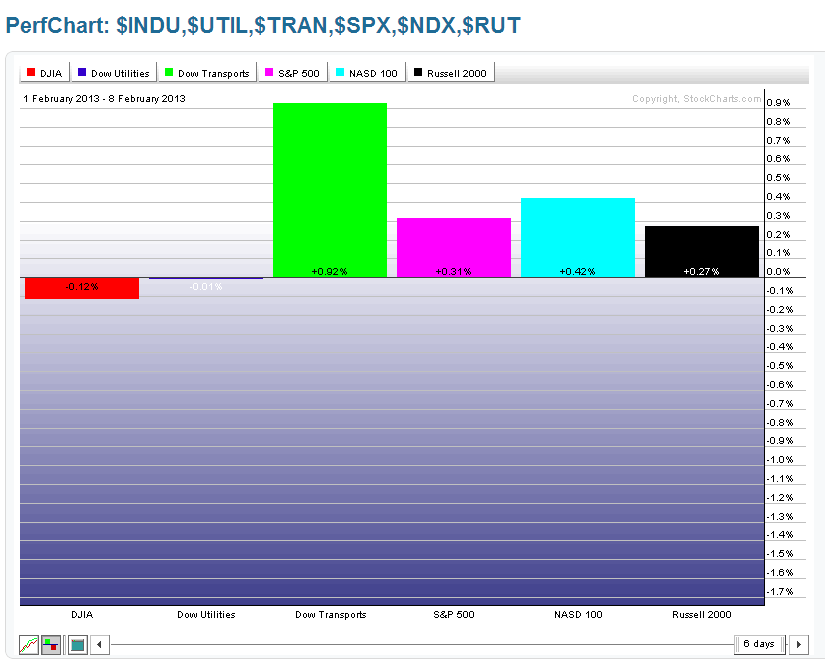
As shown on the Weekly charts and 1-Week percentage gained/lost graph below of the Major Indices, the largest gains were made in the Dow Transports, with minor gains in the S&P 500, Nasdaq 100, and Russell 2000, while the Dow 30 and Dow Utilities were, essentially, flat.
As I mentioned in my last weekly update, I was going to be watching to see if the Nasdaq and Utilities played catch-up. The Nasdaq only produced minor gains, while none were achieved in Utilities.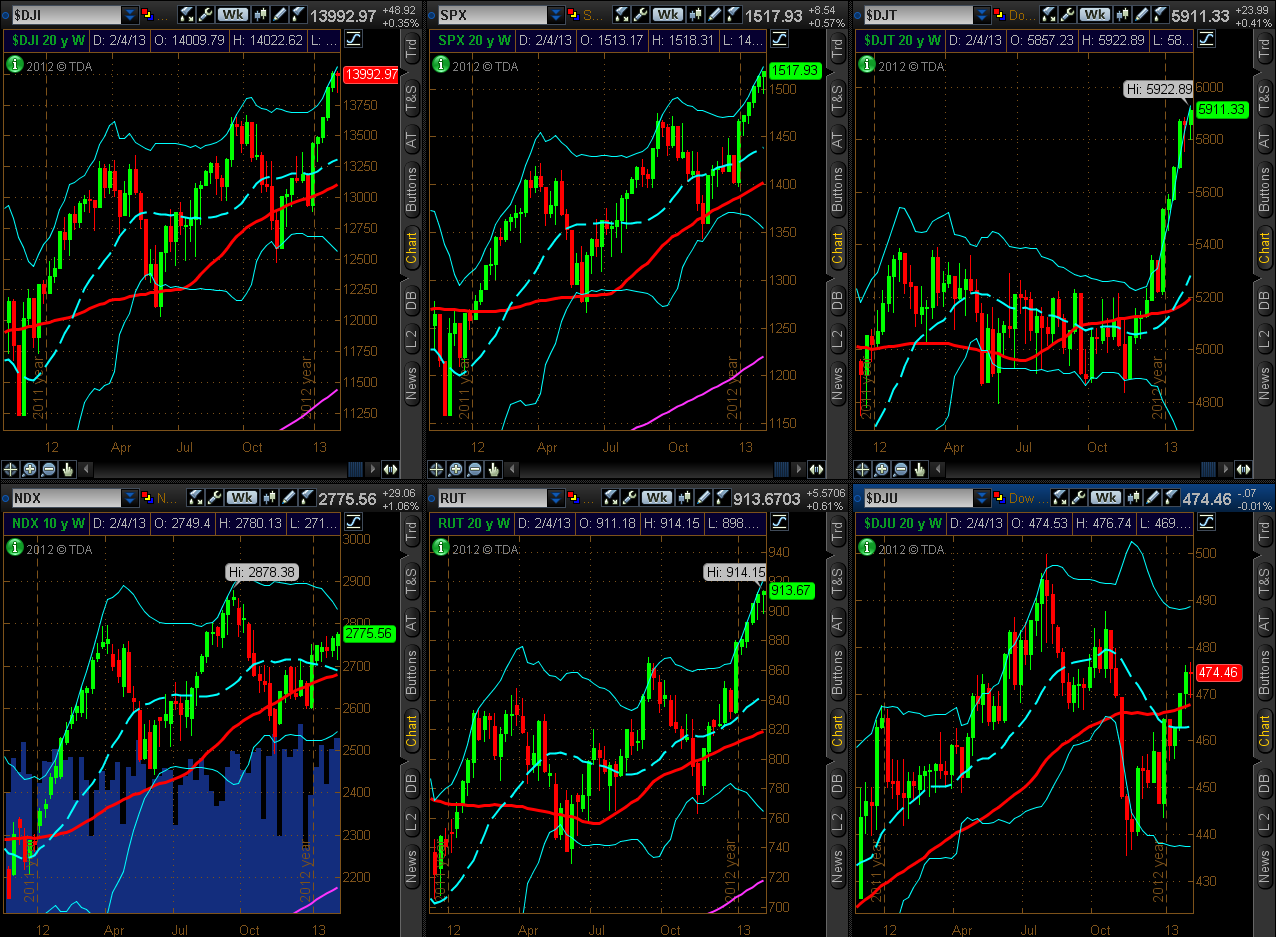
9 Major Sectors
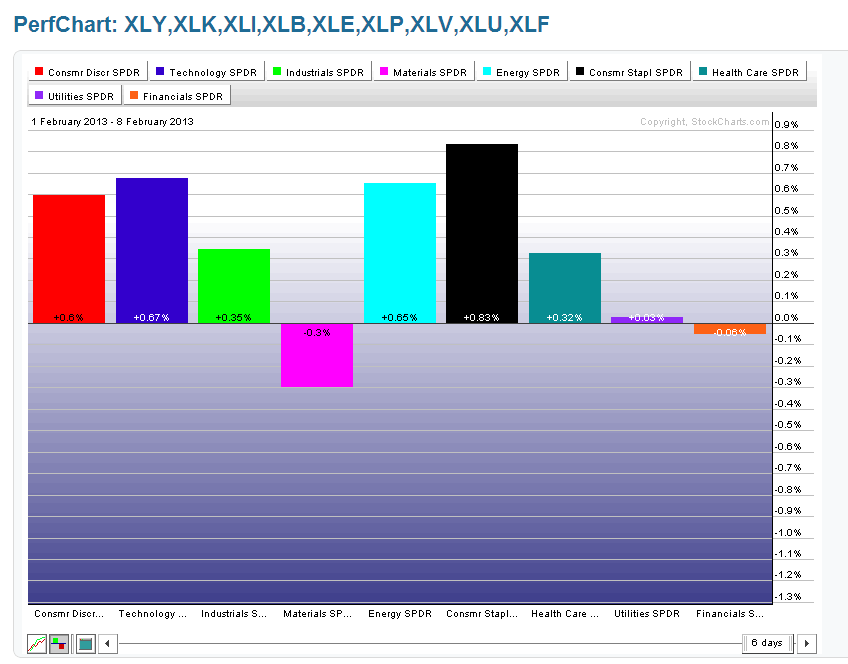
As shown on the Weekly charts and 1-Week percentage gained/lost graph below of the Major Sectors, the largest gains were made in Consumer Staples, followed by Technology, Energy, Consumer Discretionary, Industrials, and Health Care. Utilities and Financials were flat, and Materials ended in a loss.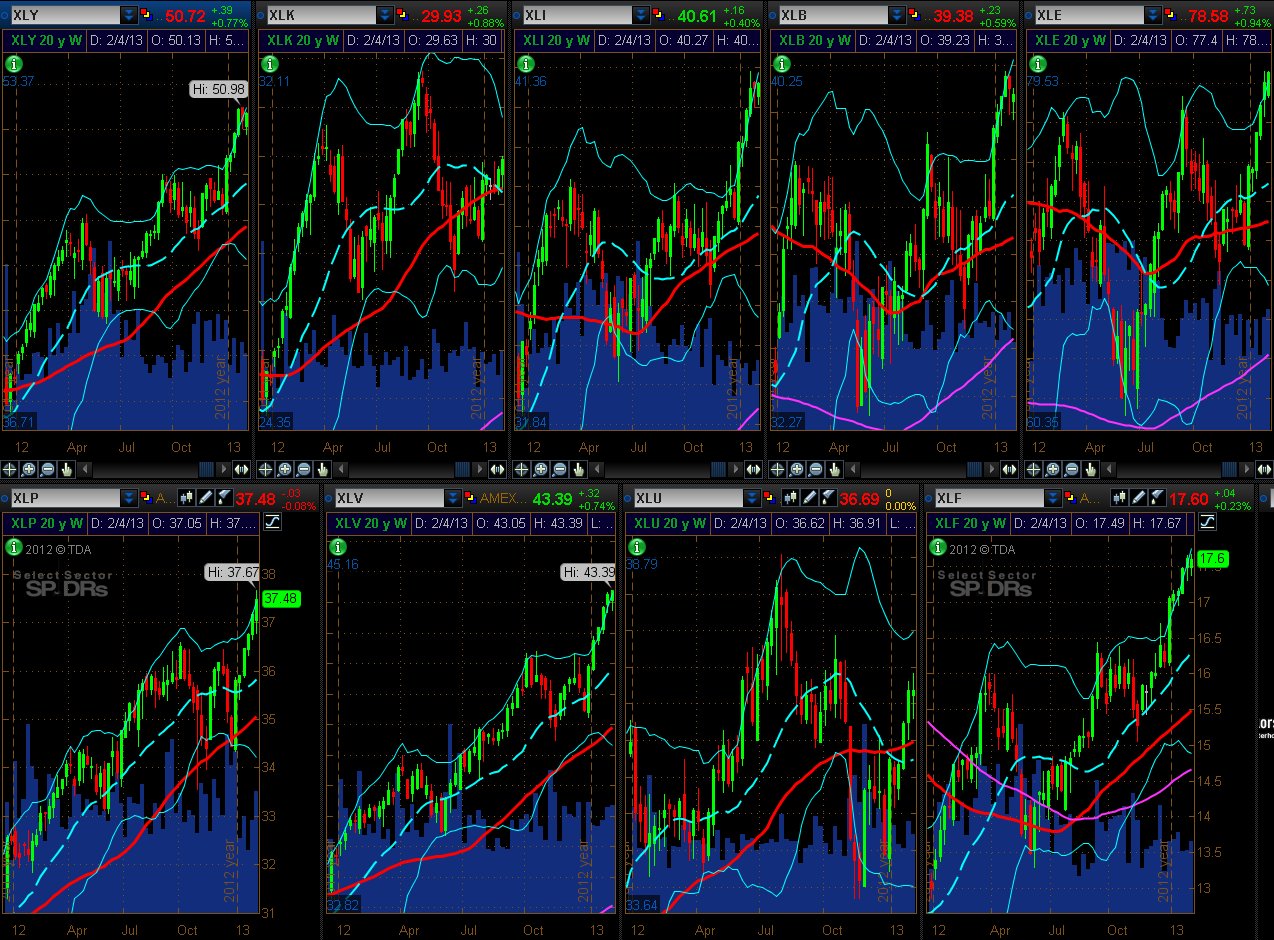
Financial Stocks
As shown on the Weekly charts below, there were either small gains made in the bank and credit card stocks, or they were flat on the week. Volumes are low, and they are pushing up against their upper Bollinger Bands in overbought territory.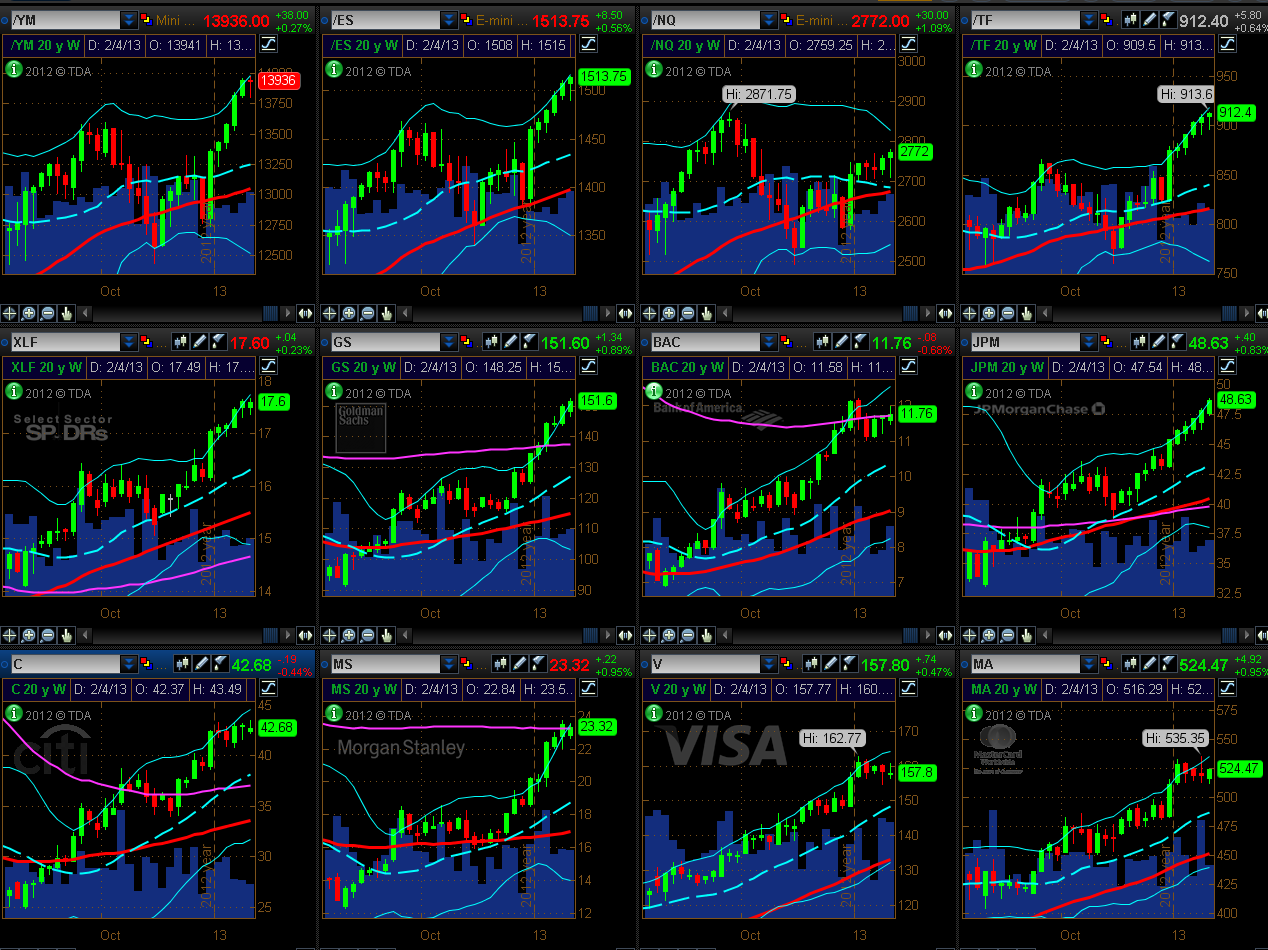
Social Media Stocks/ETF & BBRY
As shown on the Weekly charts below, there were varying levels of interest in these cheaper, beaten-down high-beta (mainly social media) stocks (and social media ETF), although LNKD spiked considerably higher after its earnings report was released this week. All of them, with the exception of FB, are pushing up against their upper Bollinger Bands. These are ones to watch going forward to gauge the amount of risk-appetite that may or may not be continuing by market participants and, to what degree (by higher or lower volumes).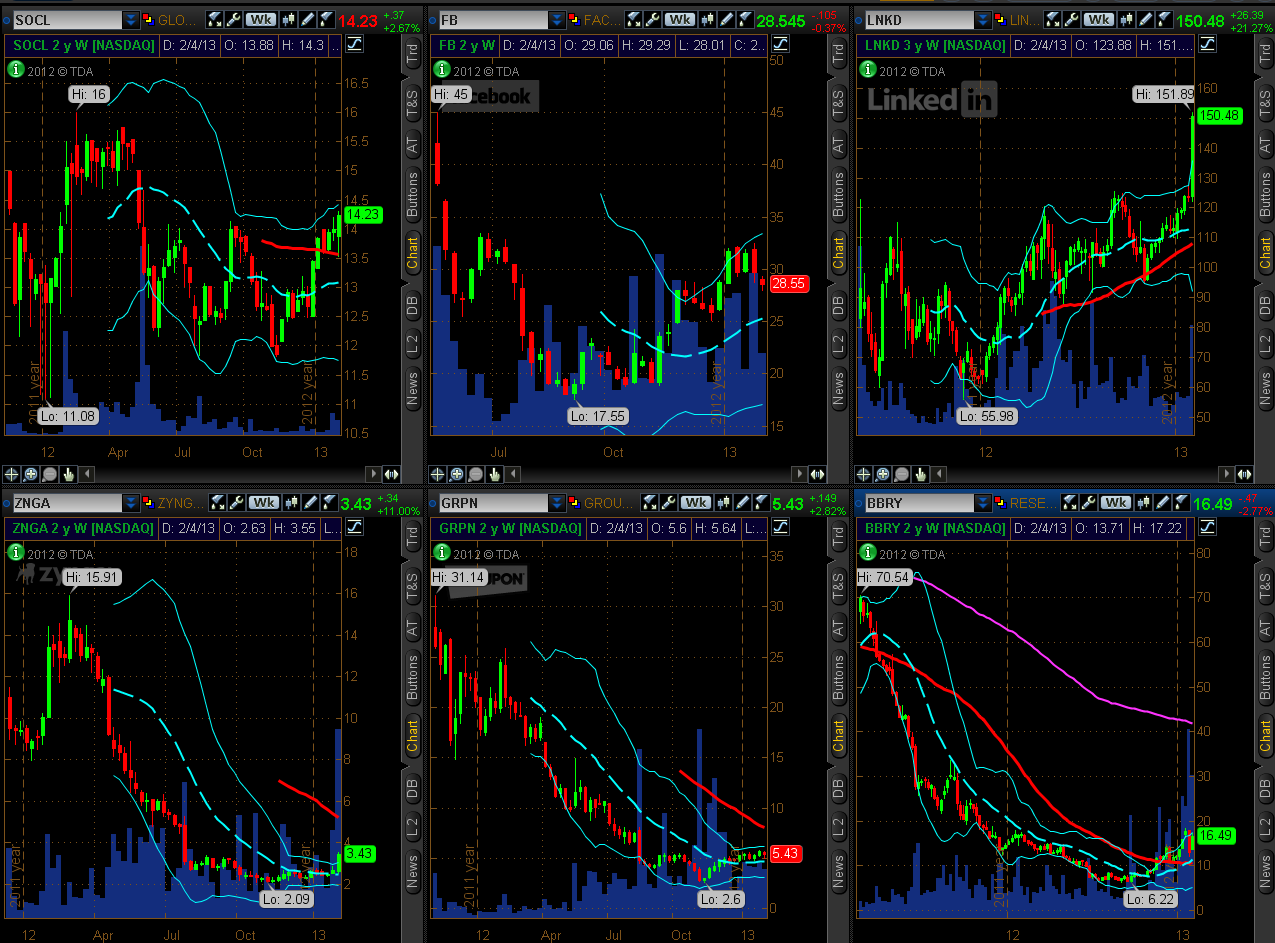
30-Year Bonds
Price dropped below major support a couple of weeks ago, as shown on the 5-Year Weekly chart below, but bounced back up this week to close just below what is now major resistance, on higher volumes. A break and hold above this major resistance level would question whether non-Fed money is, in fact, fleeing out of 30-Year Bonds in any meaningful or impactful way (to be put to use in buying other markets). 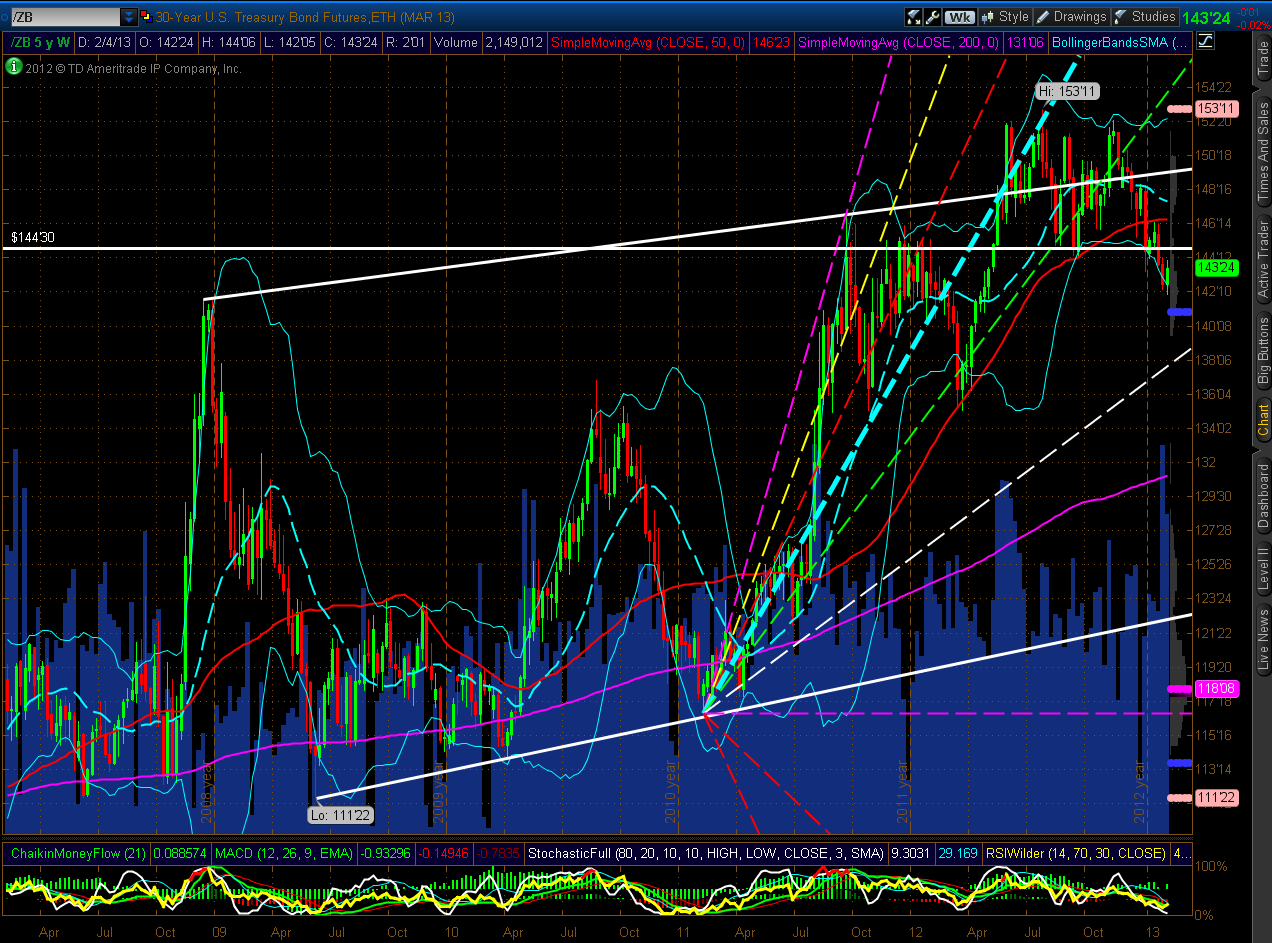
U.S. $
As shown on the 5-Year Weekly chart below of the U.S. $, price bounced back this week to close above the 80.00 level. This price level represents the level at which the highest volume of trades has occurred during the 5-year chart period (the POC or pink horizontal line on the Volume Profile along the right hand side of the chart) and would be the dividing line between bull and bear sentiment in this currency. Traders returned to the "safety trade" in the dollar, and, as can be seen above, bonds.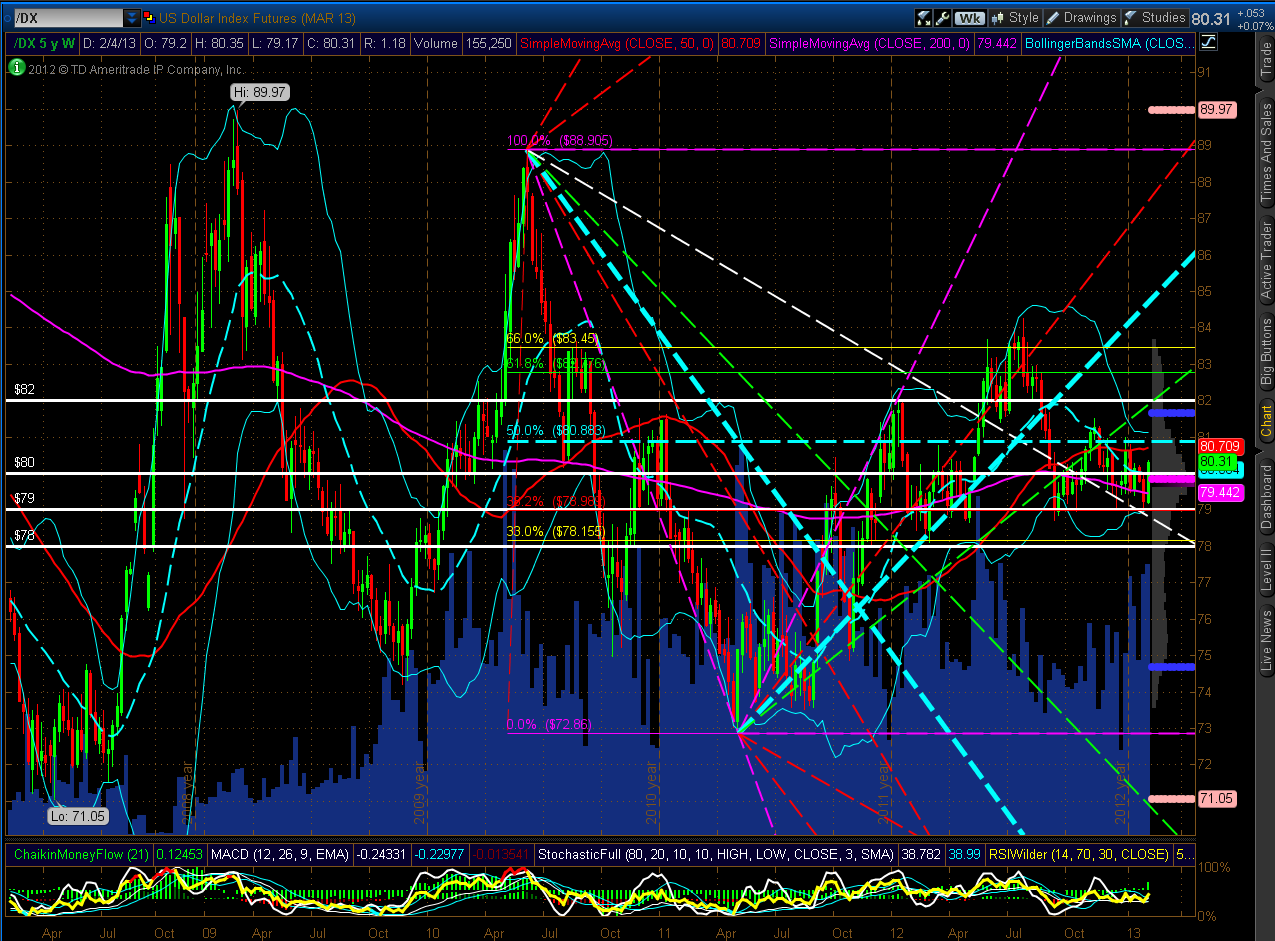
Summary
In summary, holders of long positions (in equities) are carrying an enormous amount of risk at the moment. Accordingly, we may see further slow, choppy, shallow movements, and small weekly gains if the equity markets continue their trek upwards, while participants rotate into and out of various sectors. Alternatively, it may not take much in the way of foreign or domestic negative news to prompt them to begin taking profits in these positions, and we may see some kind of general market pullback. Events such as this coming Options Expiration Friday, the market closure on the following President's Day Monday, and resolution of the Fiscal by the beginning of March may produce some kind of impact on markets, either positive or negative, and we may see a rise in intraday volatility as we near those dates.
Lower weekly volumes of late (other than the recent volume spikes in the cheaper, beaten-down Social Media stocks and BBRY) indicates to me that there are fewer buyers willing to take on such high risk at the moment, so we may, indeed, see a pullback come into play, sooner rather than later.
Furthermore, a return to the U.S. $ and 30-Year Bonds indicates that participants are hedging against such increased downside risks.
No doubt, the recent small advancement in AAPL has helped to prop up the Nasdaq 100 and S&P 500 Indices, so it's worth keeping an eye on that one, along with those mentioned above, as well as Japan's Nikkei Futures Index, the EUR/USD Forex pair, and my Fed Monetary Stimulus Program "Canaries," which have been showing signs of stress and weakness, as I discussed in their respective posts this past week.
Markets in China will be closed this week, due to Chinese New Year celebrations of the Year of the Water Snake (which begins on Sunday), as the Year of the Water Dragon is ending. I wish Chinese people all around the world a safe and Happy New Year...may we all prosper in 2013!
