Further to my last weekly market update, this week's update will look at:
- 6 Major Indices
- 9 Major Sectors
- VIX
- Index/Volatility Ratio Charts
- 30-Year Bonds
- U.S. $
- 3 Days/Candle Charts on 7 Major Indices
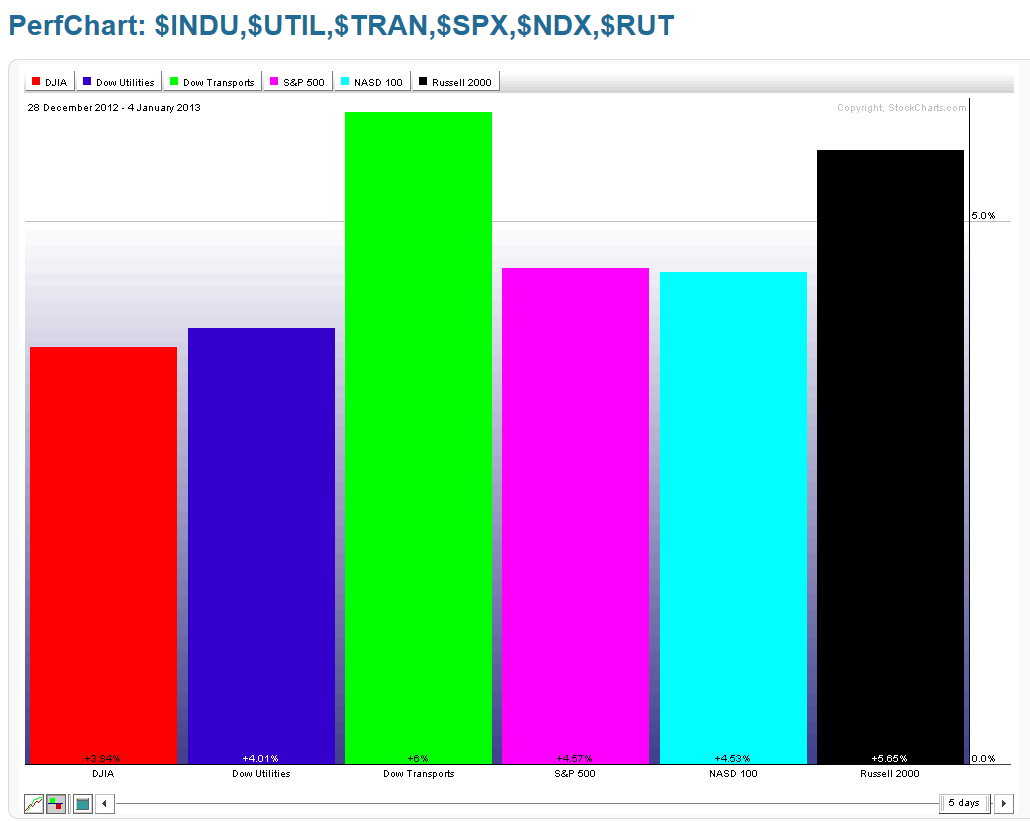
As shown on the Weekly charts and 1-Week percentage gained/lost graphs below, all six Major Indices gained between 4 and 5% on the week.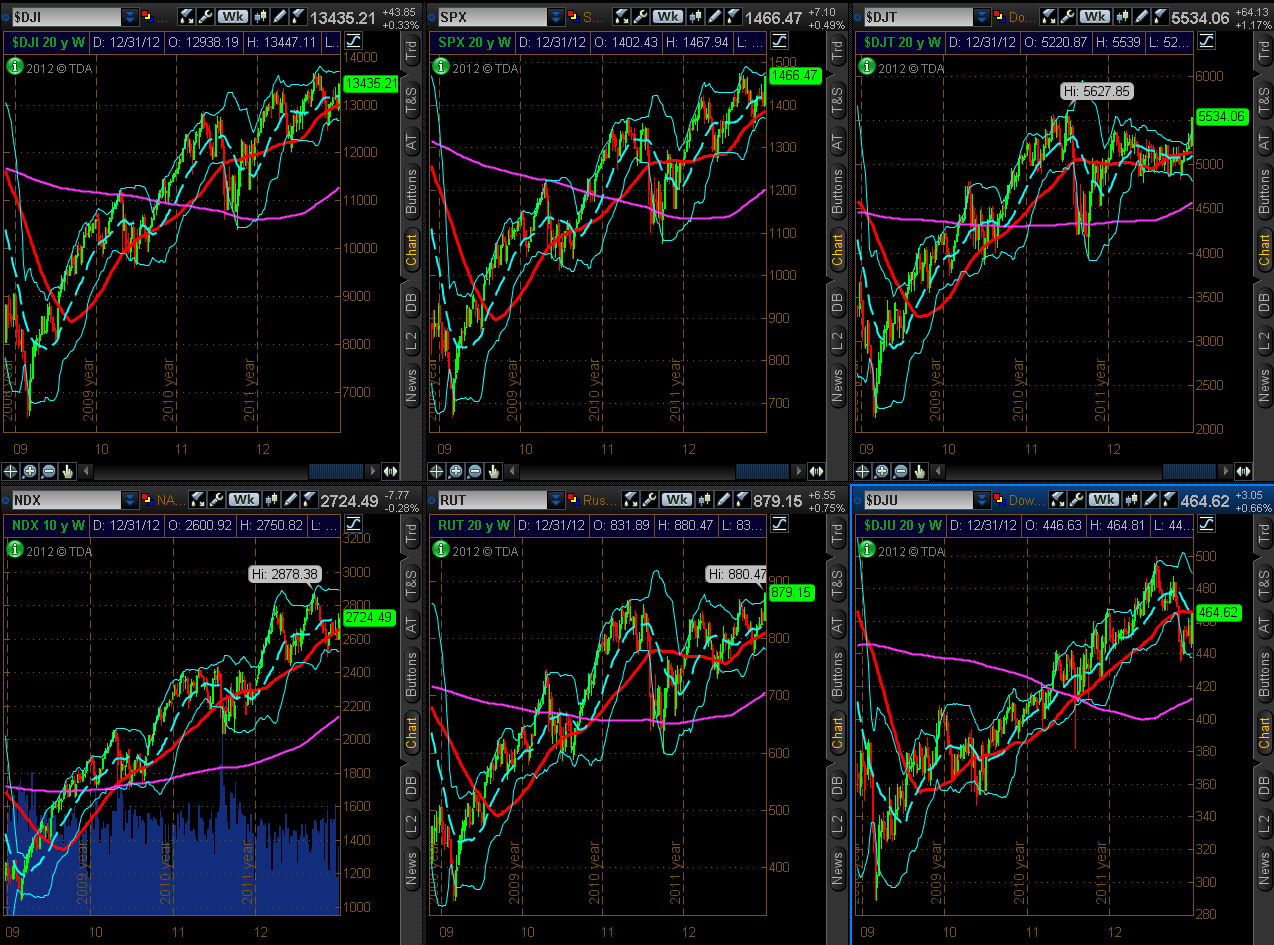
9 Major Sectors
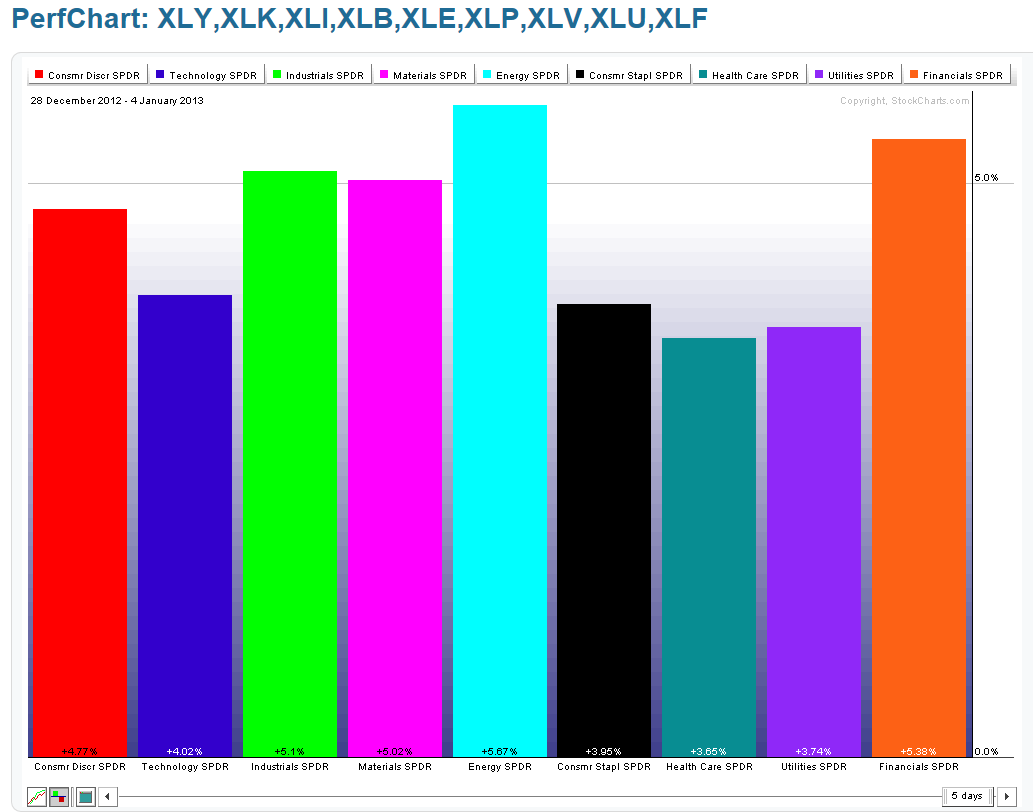
As shown on the Weekly charts and 1-Week percentage gained/lost graphs below, all nine Major Sectors gained between 3.5% and 5.5% on the week.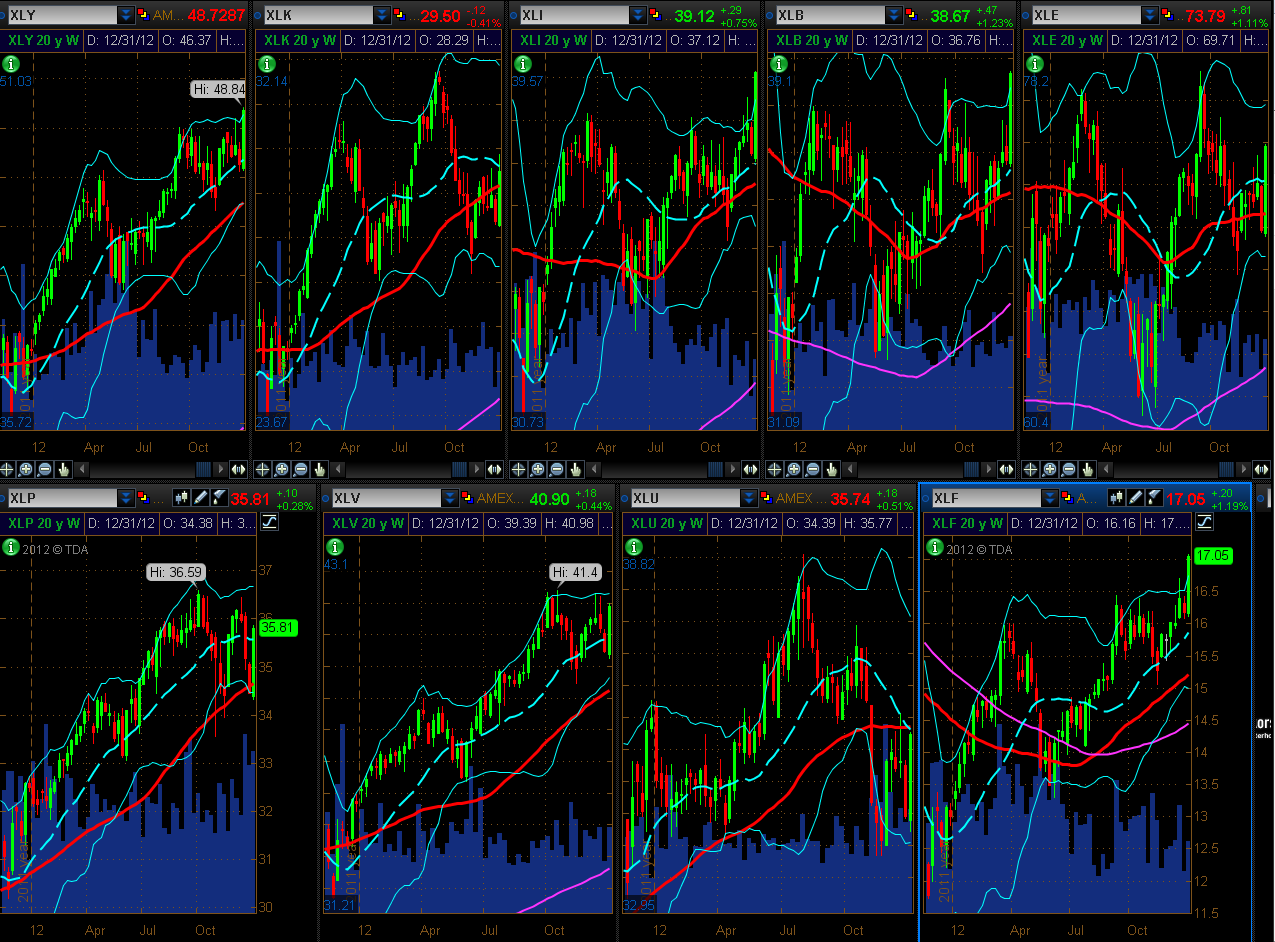
VIX
As shown on the 10-Year Weekly chart below, the VIX closed the week at 5-Year lows. Whether it pops from this level, or simply bases for awhile, remains to be seen.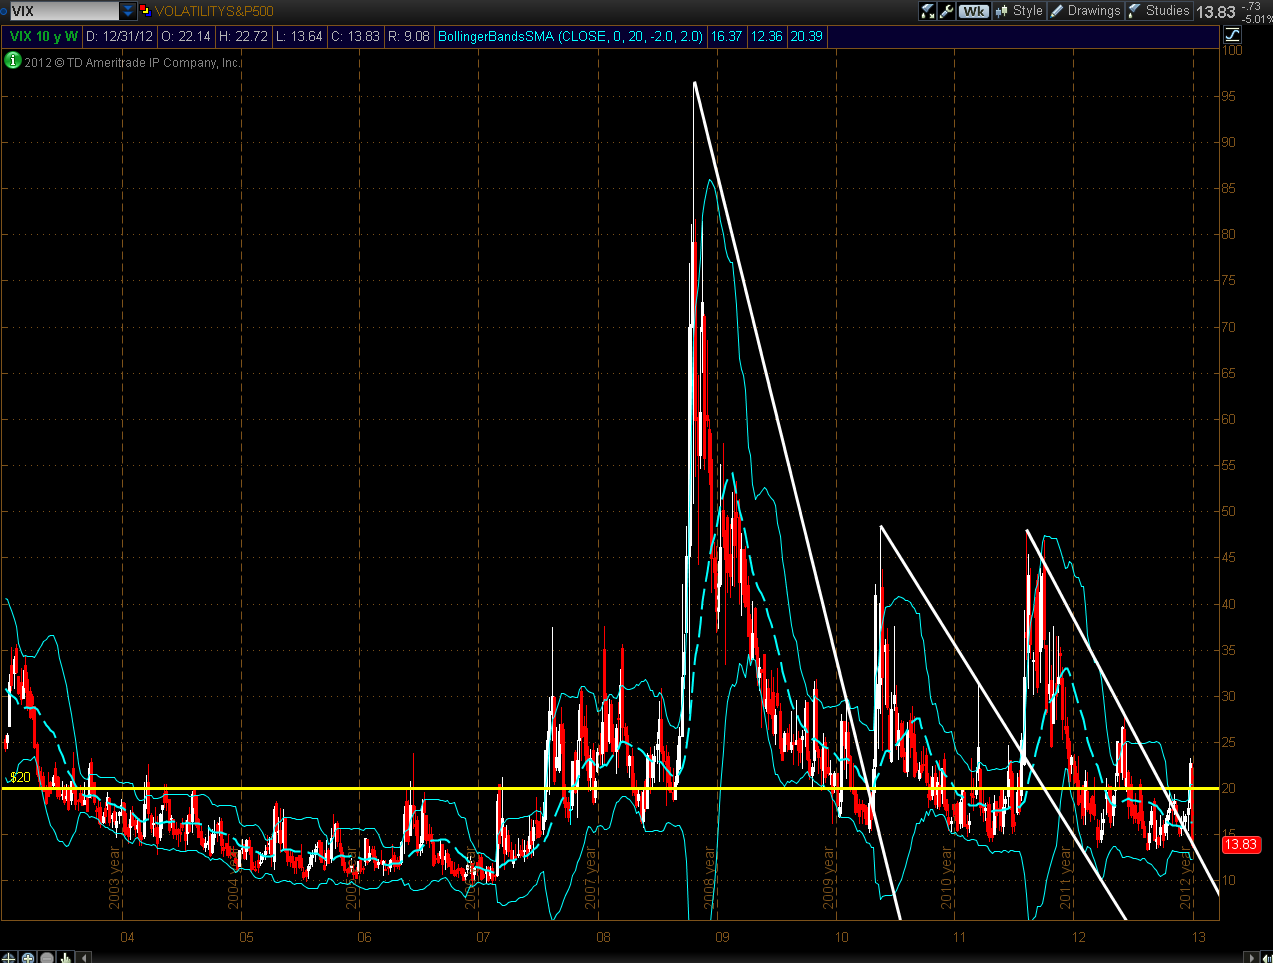
Index/Volatility Ratio Charts
As shown on the 10-Year Weekly ratio chart below of the SPX:VIX, price closed at 2012 highs. The next resistance levels are at 125 and 150, respectively. Assuming this ratio can rally and hold above today's closing price of 106, we may see further buying in the SPX Index...to confirm, I'd see if the Momentum indicator remains above zero on the weekly timeframe.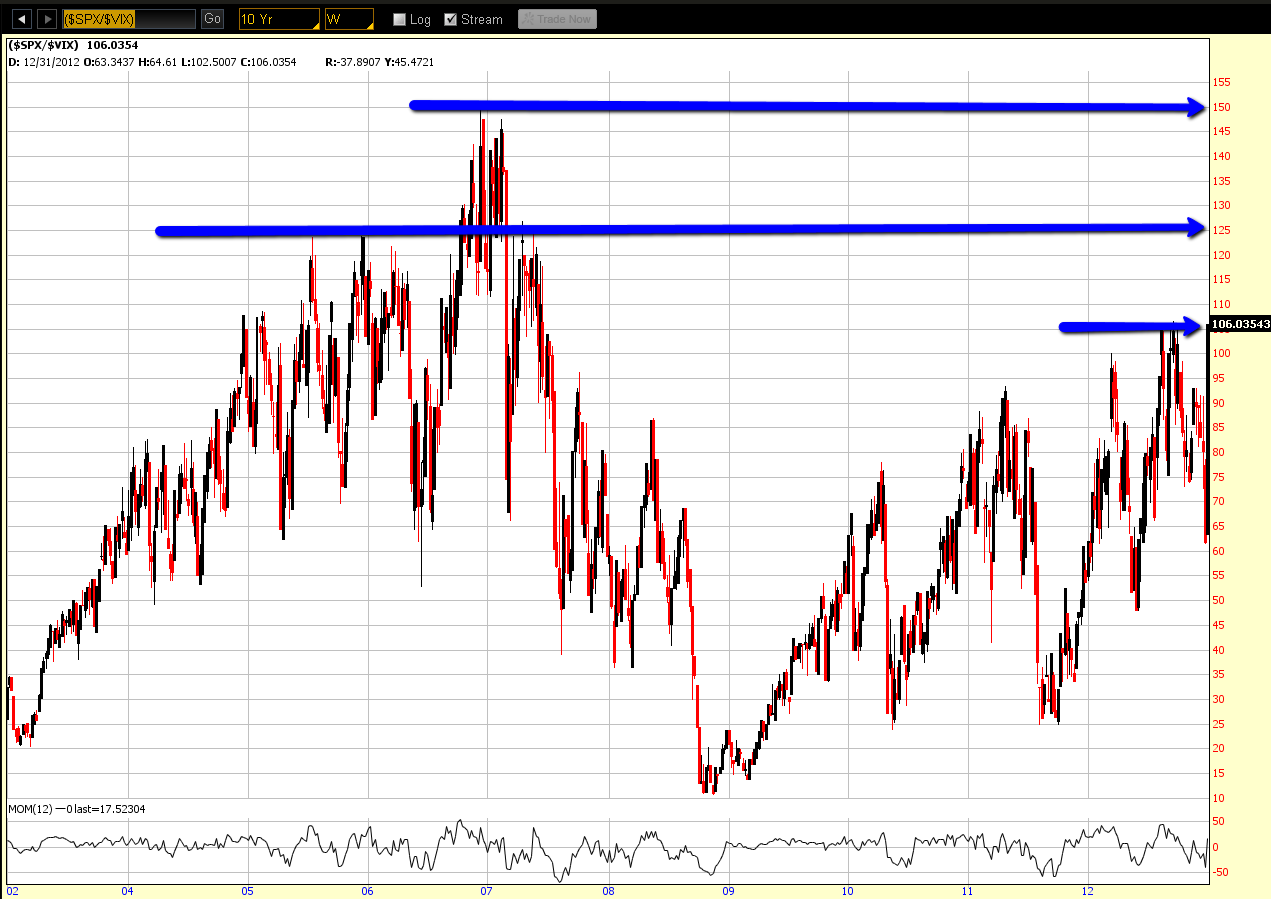
As shown on the 10-Year Weekly ratio chart below of the RUT:RVX, price reached and closed at an all-time high today. Price on the Russell 2000 Index also reached and closed at an all-time high today. Assuming this ratio can rally and hold above today's closing price of 51, we may see further buying in the RUT Index...to confirm, I'd see if the Momentum indicator remains above zero on the weekly timeframe.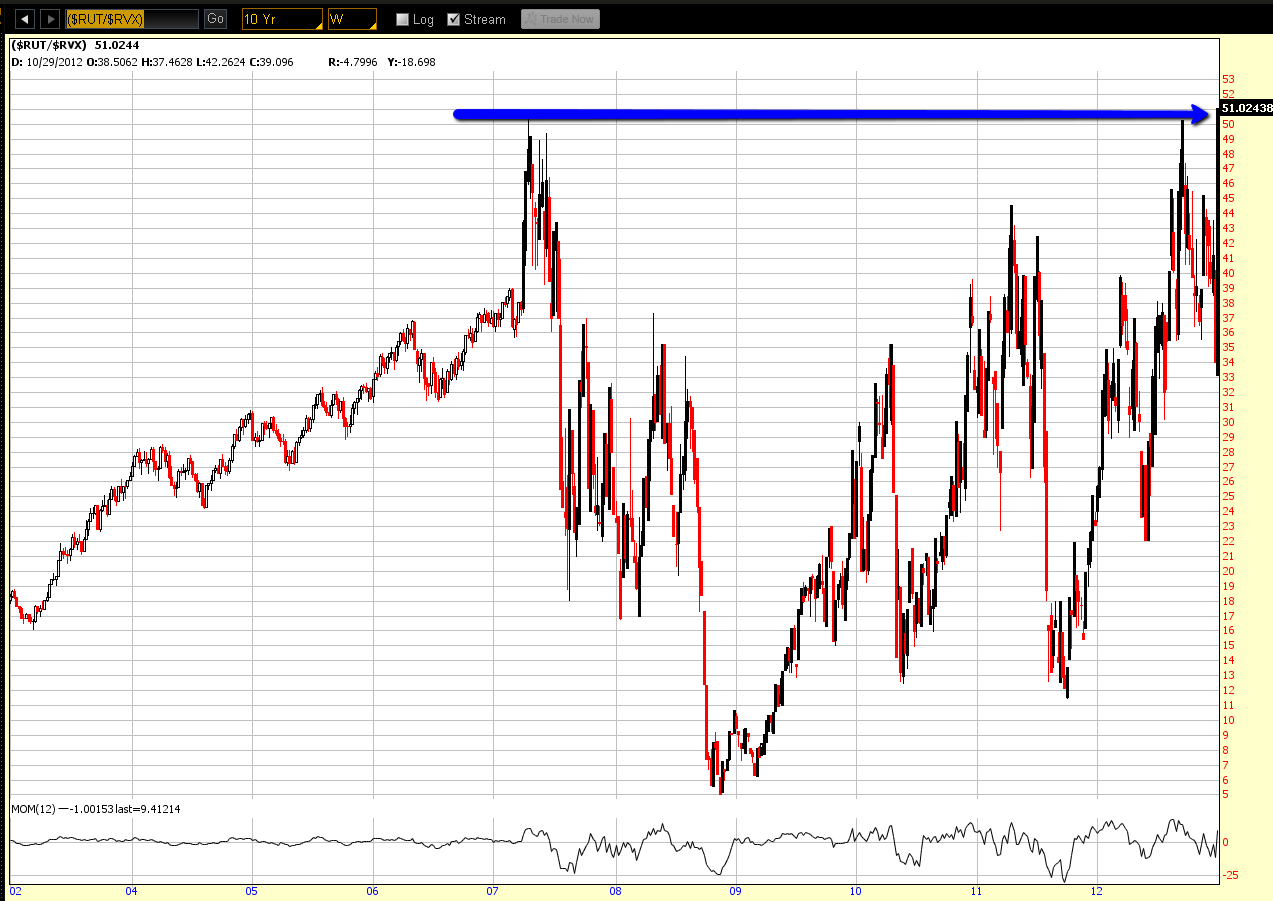
As shown on the 10-Year Weekly ratio chart below of the NDX:VXN, price rallied this week and made a higher swing high. It's approaching the 2012 highs. Assuming this ratio can rally and hold above 170, we may see further buying in the NDX Index...to confirm, I'd see if the Momentum indicator remains above zero on the weekly timeframe.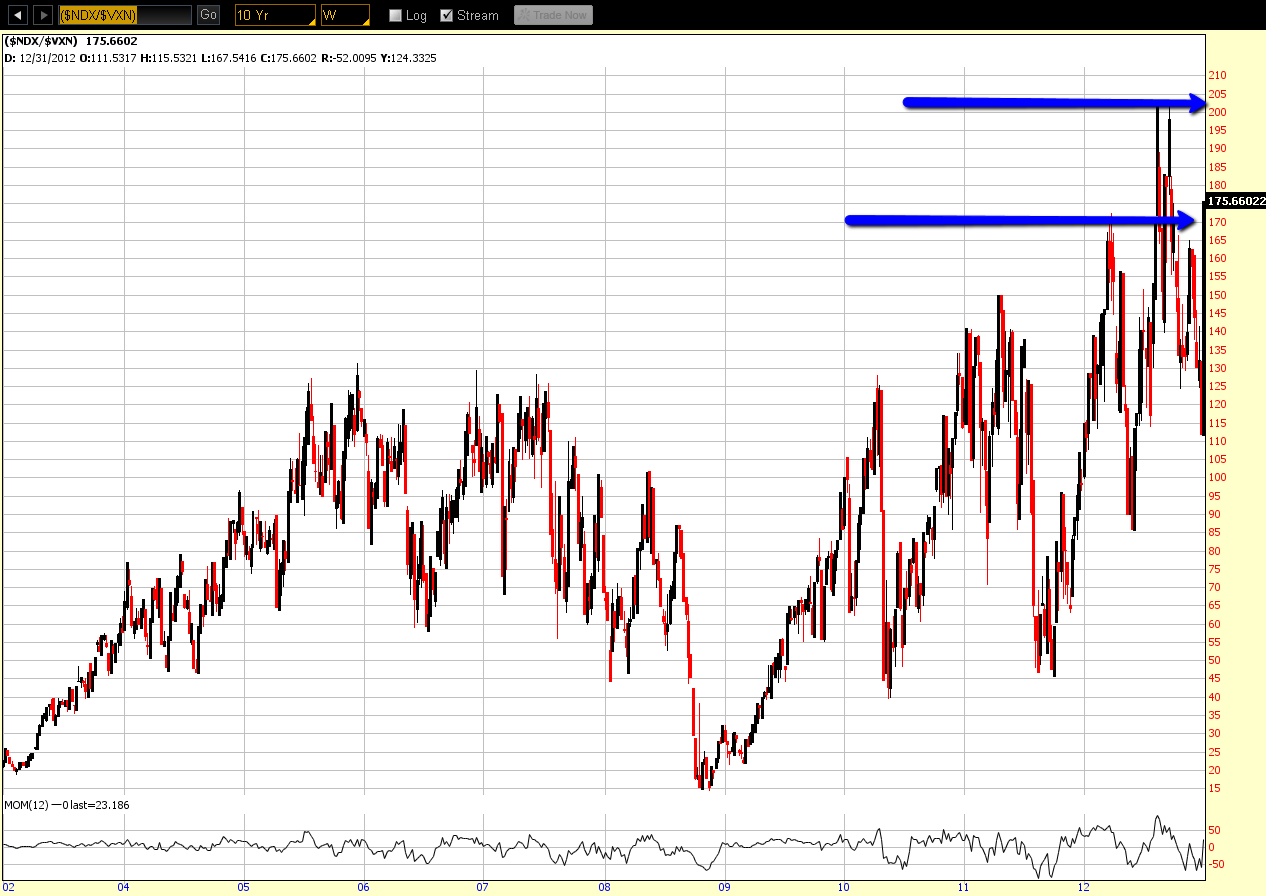
30-Year Bonds
As shown on the 5-Year Weekly chart below of 30-Year Bonds, price closed just a fraction below major support on the week, but on lower holiday volumes. I'd look for another close lower by next Friday on higher volumes before I would assume that selling has begun in earnest.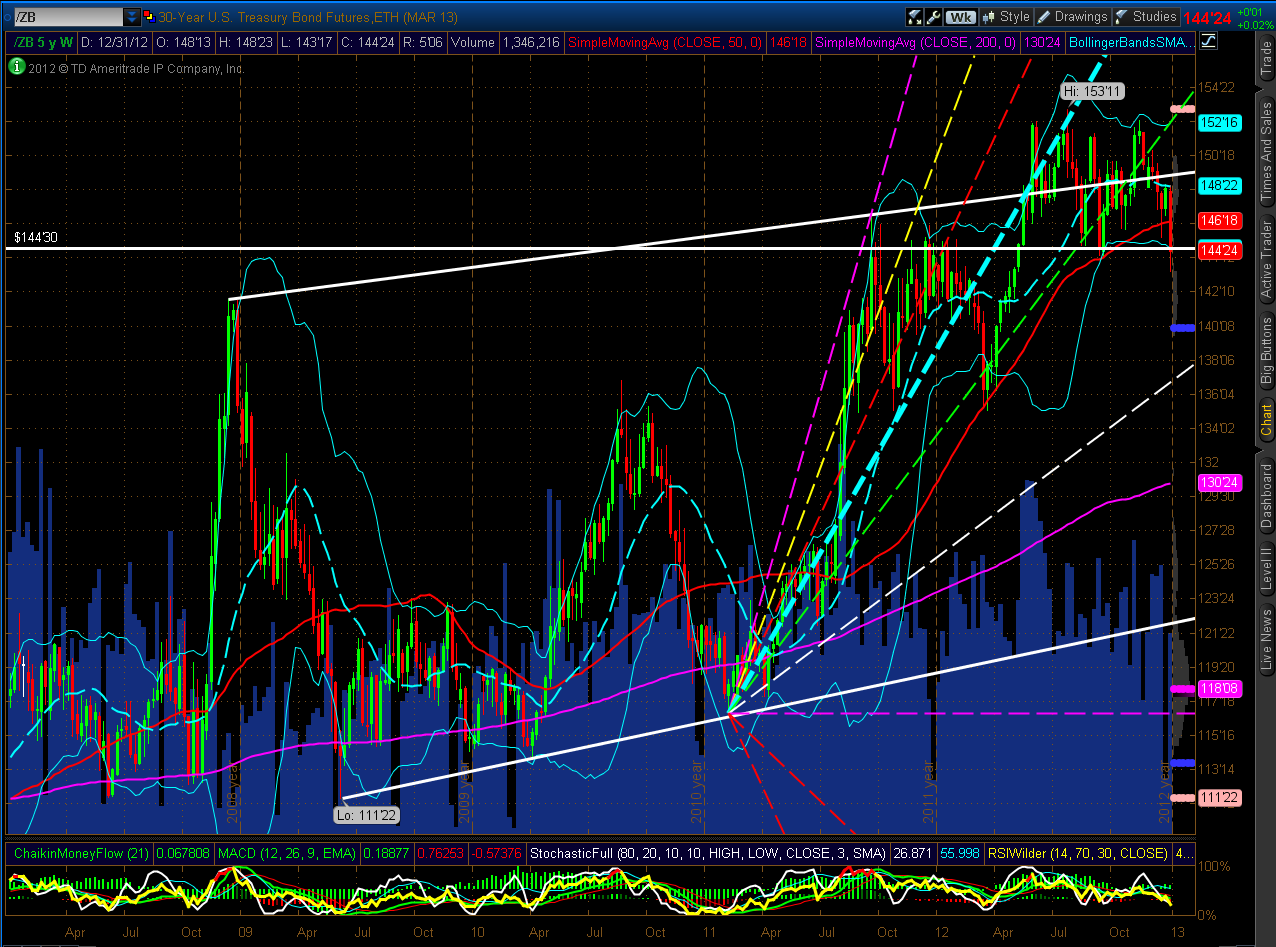
U.S. $
As shown on the 5-Year Weekly chart below of the U.S. $, price closed higher on the week on decent volumes. It's been bouncing in between the 50 (red) and 200 (pink) MAs for a few weeks now. I'd look for a break and hold either above the 50 MA or below the 200 MA to gauge further strength or weakness in the weeks ahead.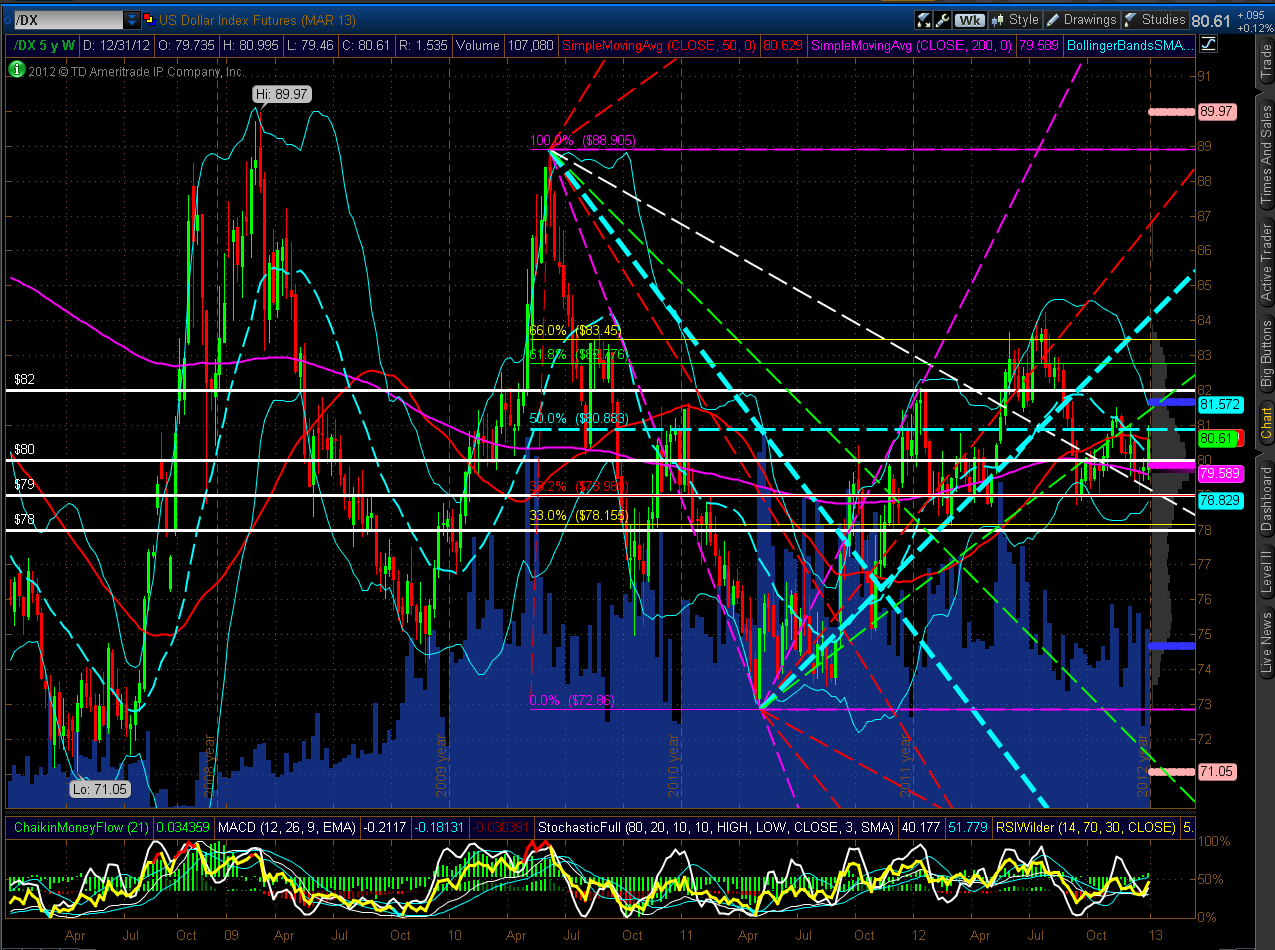
3 Days/Candle Charts on 7 Major Indices
Each candle on the following three charts represents 3 days. The current candle finished today and closed higher to confirm either a bullish engulfing or hammer setup on all seven Major Indices.
You can see that the Dow 30 and Dow Transports closed right underneath the major trendline that was broken last year. 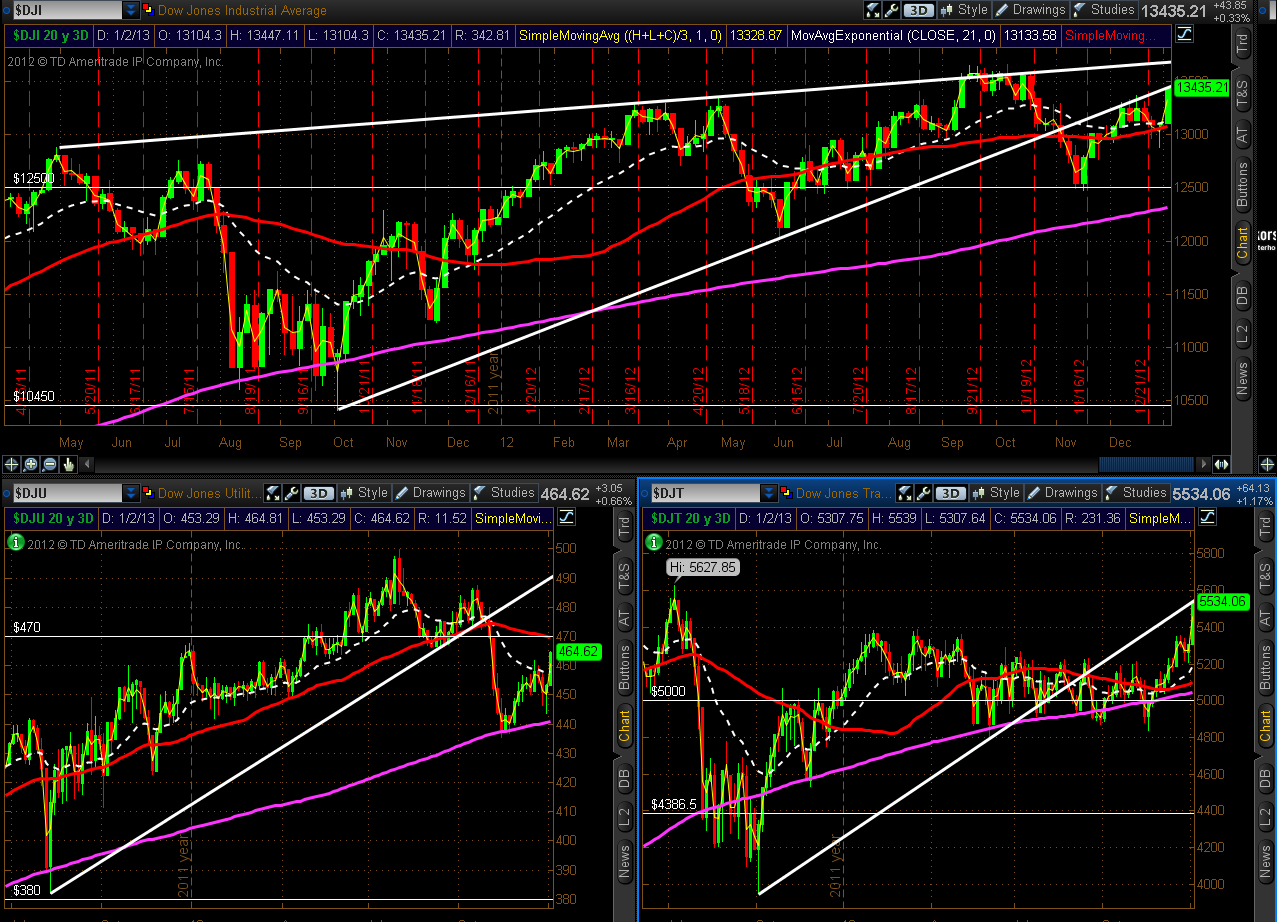
The S&P 500 and Russell 2000 Indices broke above and closed well above their major trendline.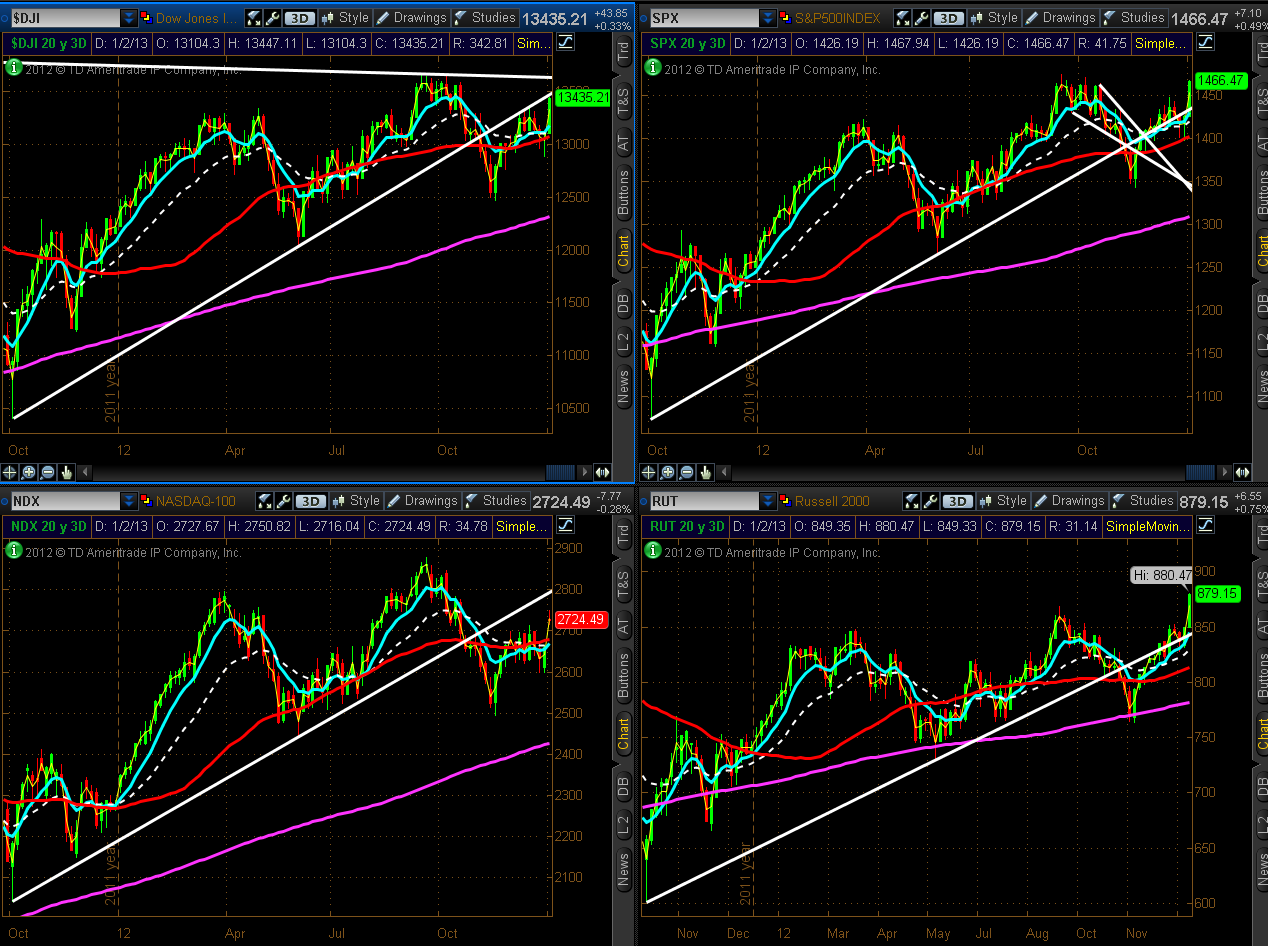
The S&P 100 Index also broke above and closed just above its major up trend line, as well as a major downtrend line from the 2000 highs...a significant achievement, particularly if these breaks hold as major support.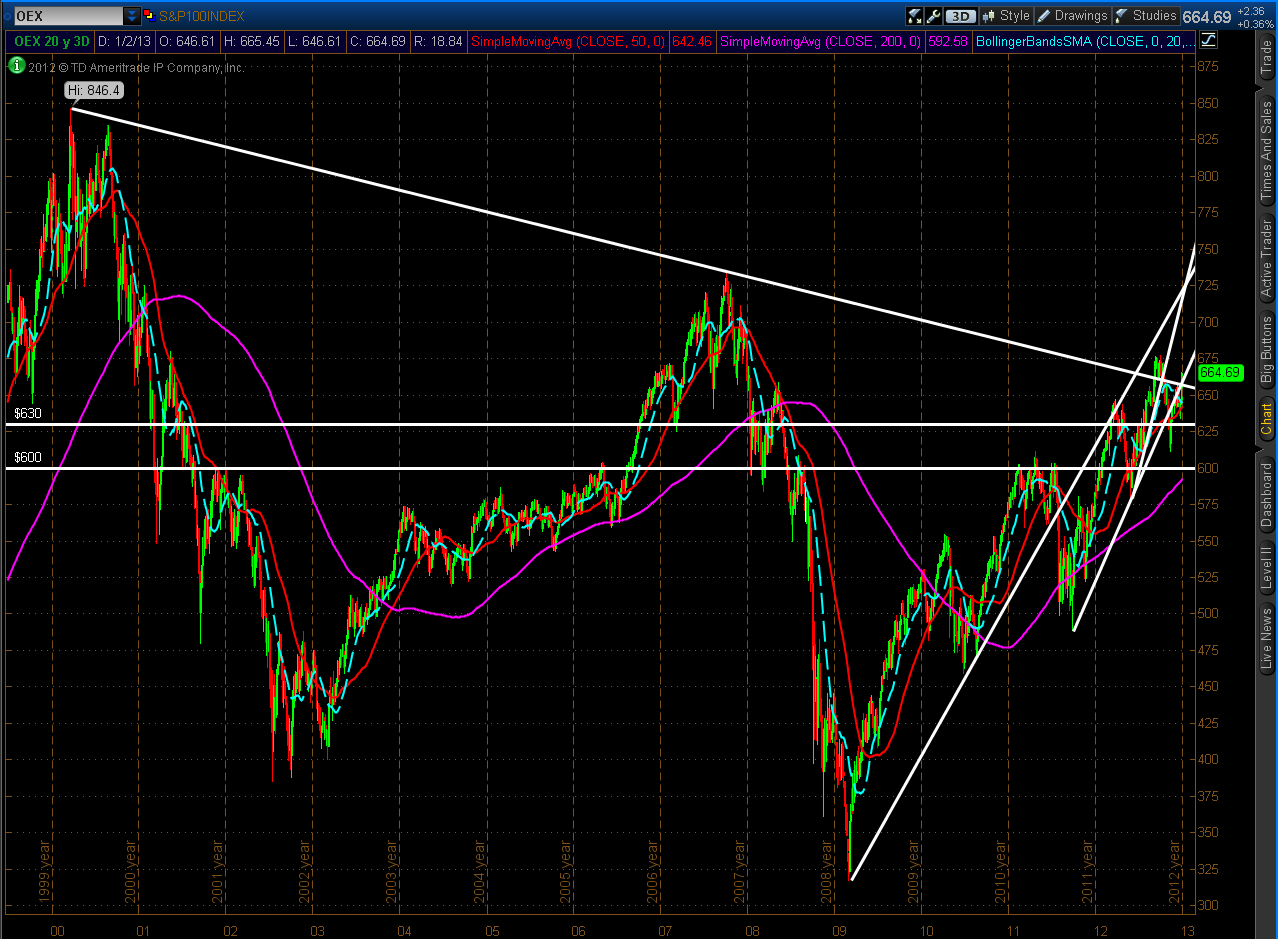
Summary
In summary, the above charts are ones I'll be watching going forward over the next few weeks.
Using the Index/Volatility ratio charts above, I'll be looking for volatility to remain low, with the Major Indices moving higher and holding above their major trendlines in order to confirm any further rally that may continue to run for the next few weeks...at least until the end of February deadline on the "Fiscal Cliff" and "Debt Ceiling Limit" issues.
Whether we see further selling in 30-Year Bonds and further buying in the U.S. $ remains to be seen...I'll need to see a break and hold one way or the other, as noted above.
Furthermore, I'll be monitoring price movement on the Russell 2000 E-Mini Futures Index, as I discussed in my post of January 2nd, as well as my "Fed Monetary Stimulus Program Canaries," as I last discussed in my post of December 28th, in order to gauge selling/buying sentiment.
