
...this is how I'd summarize the events that took place in world markets, as well as on American soil, this past week. My deepest sympathies go out to those law enforcement, fire fighting, and civilian victims who died or were injured in connection with the Boston marathon bombings and the Texas fertilizer plant explosions, and to all their friends and families. My thoughts and prayers are with you...may we all find answers to these terrible tragedies, and, may all those who are responsible, be brought to justice.
Further to my last Weekly Market Update, this week's update will look at:
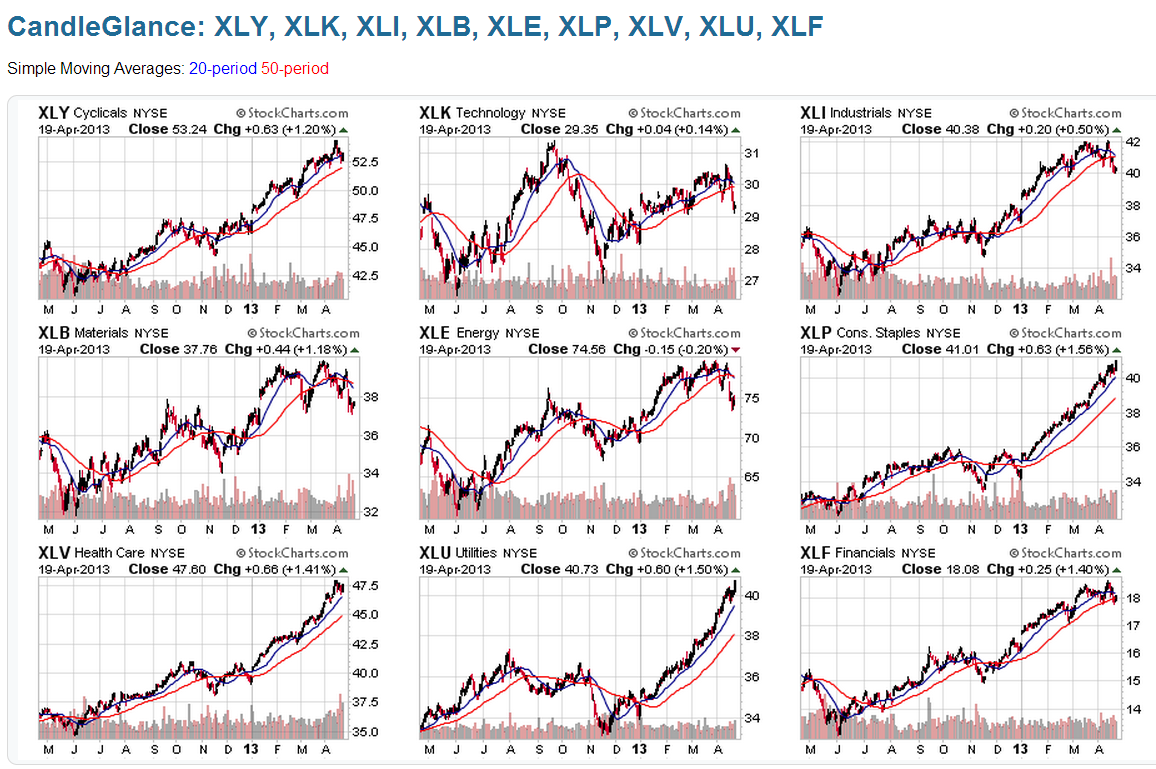
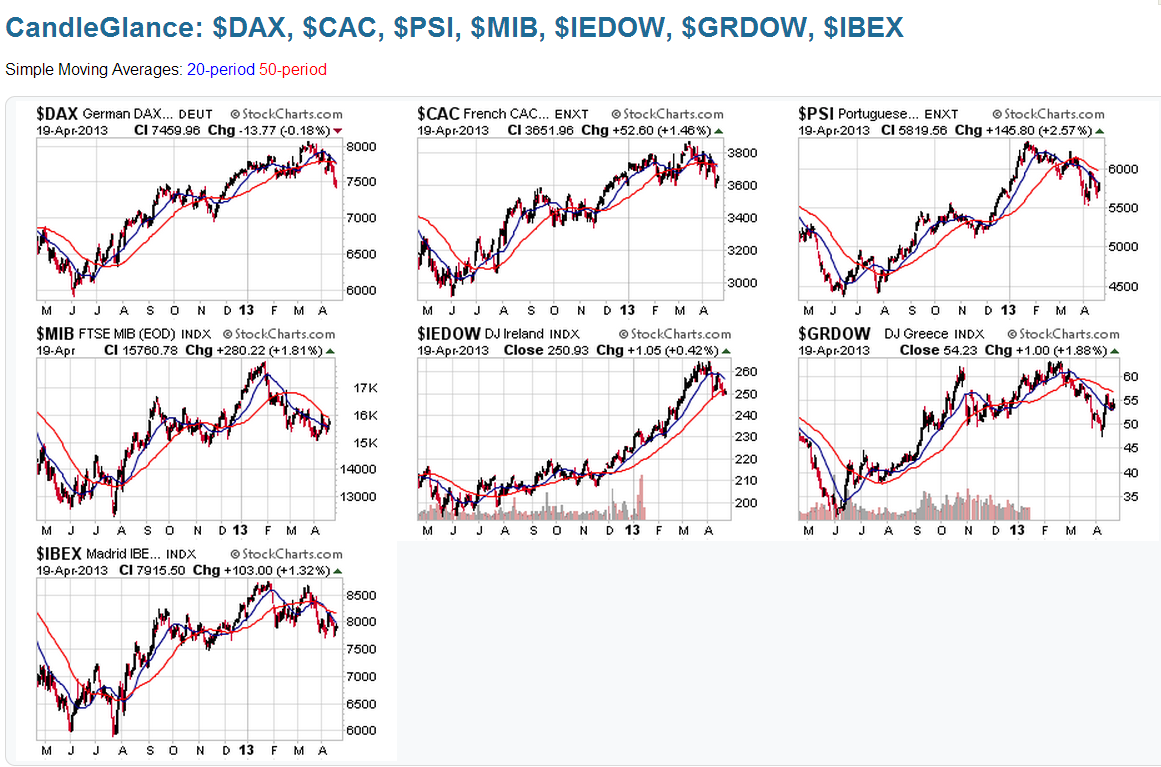
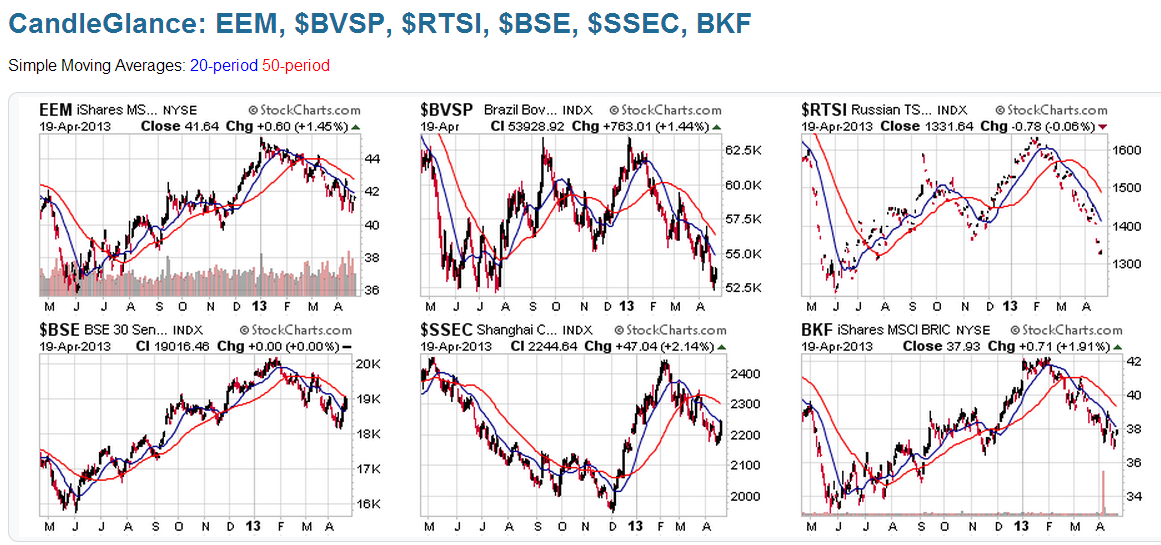
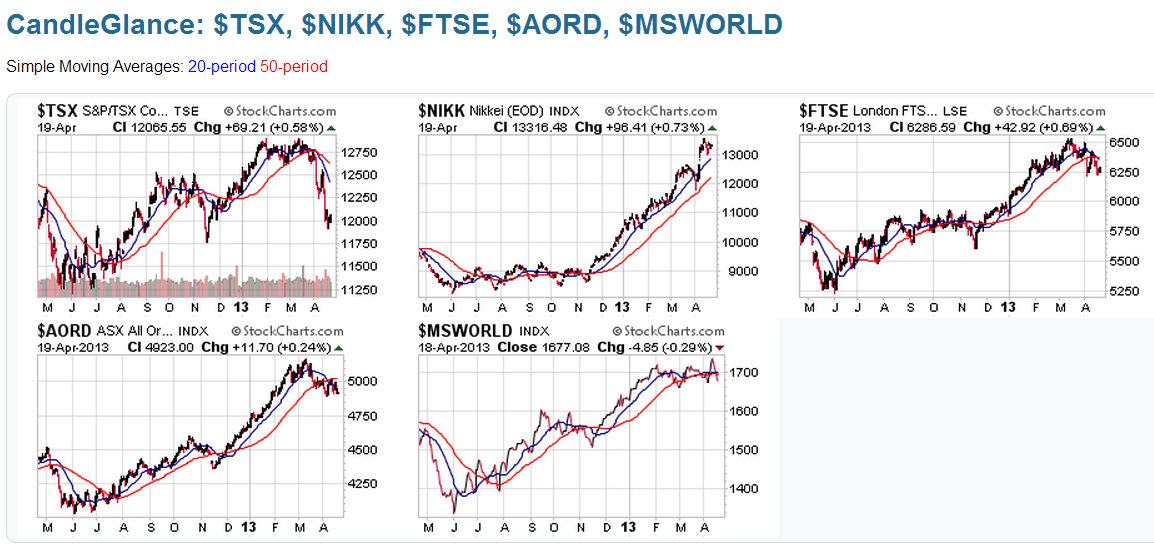
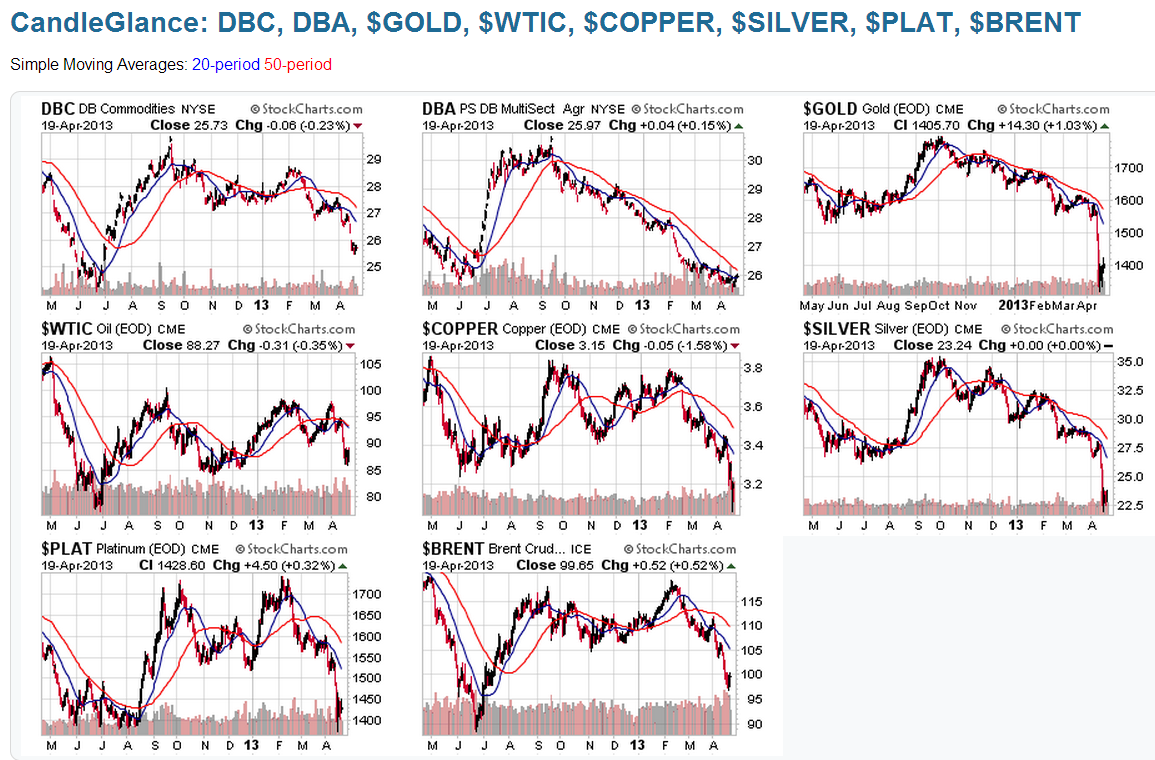
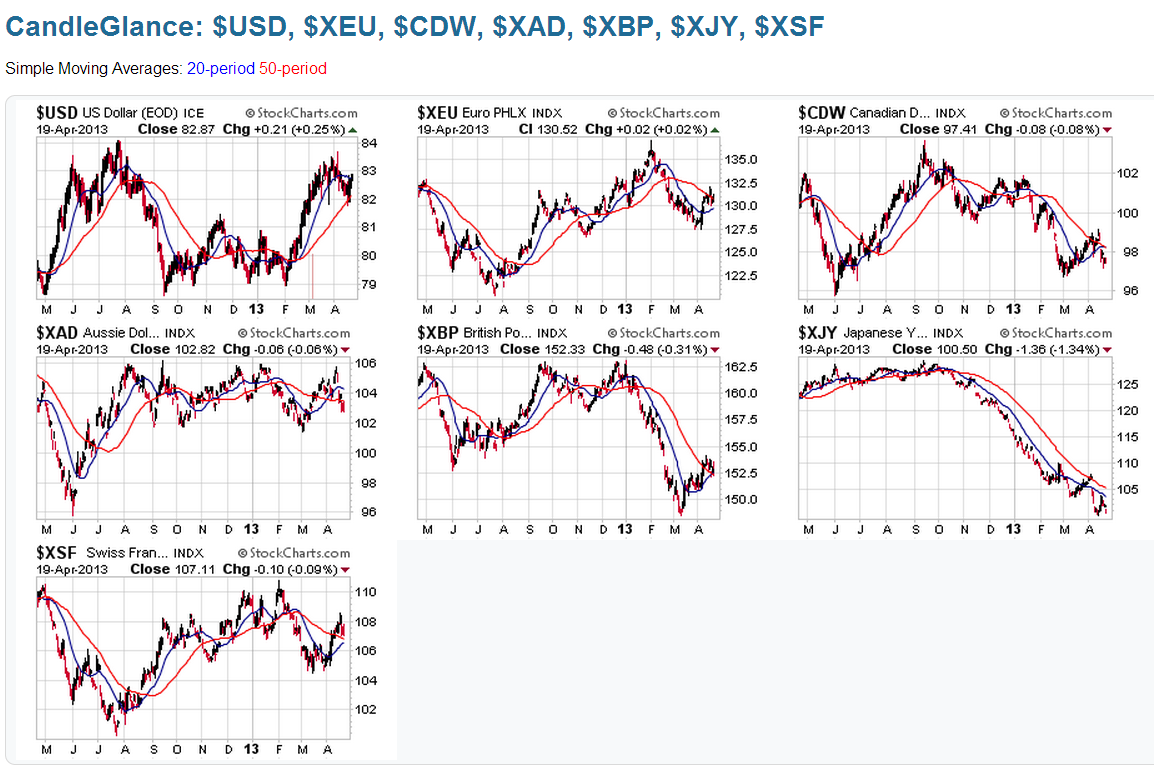
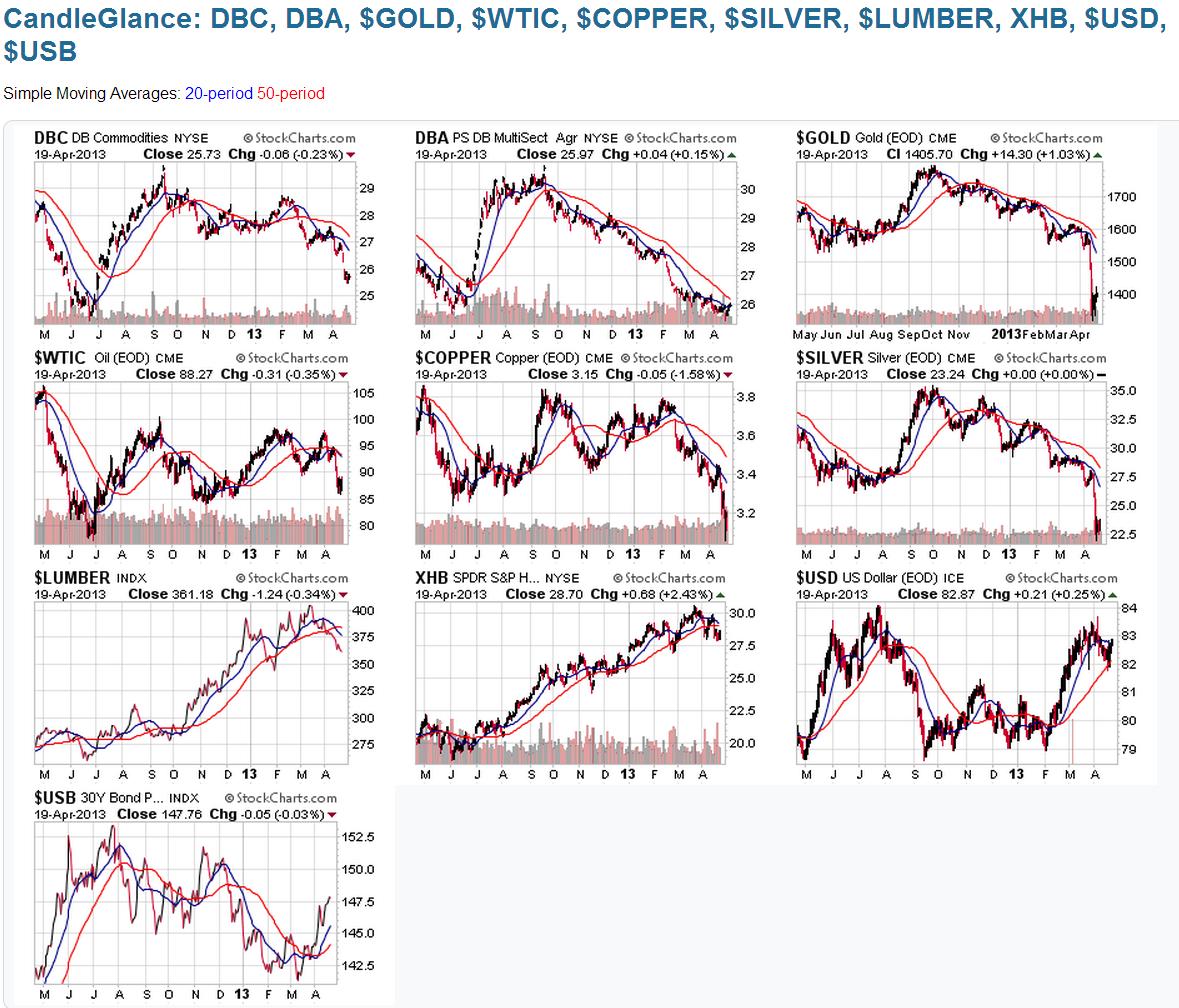
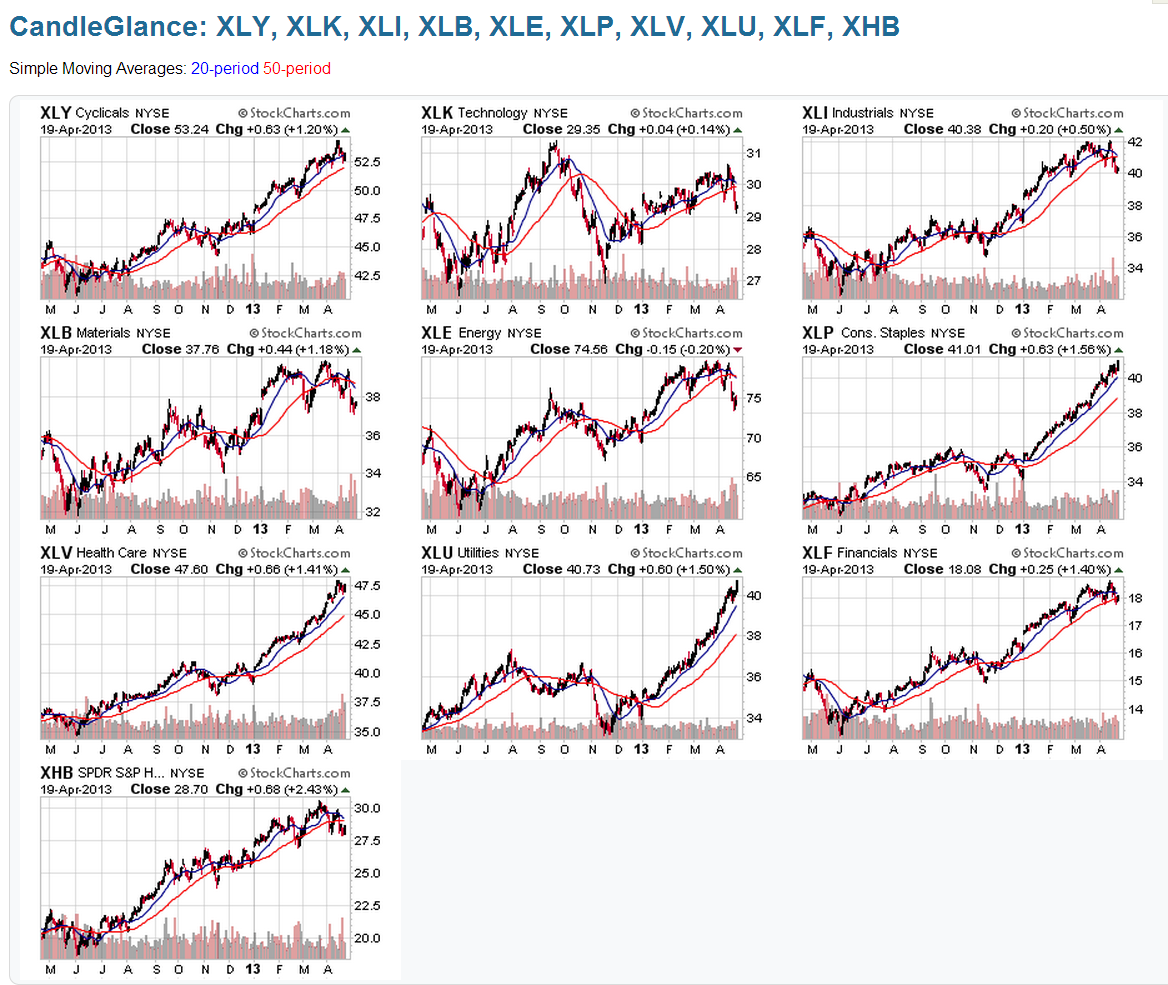
- Nine 1-Year Daily thumbnail chartgrids of a variety of markets around the world
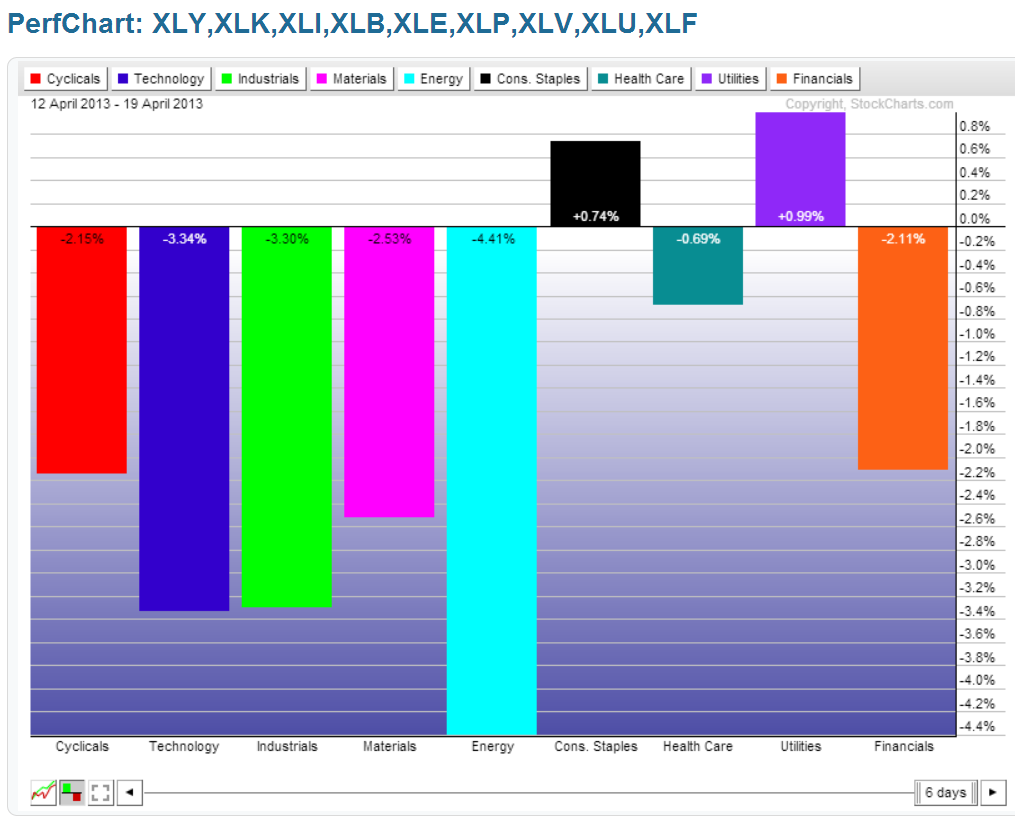
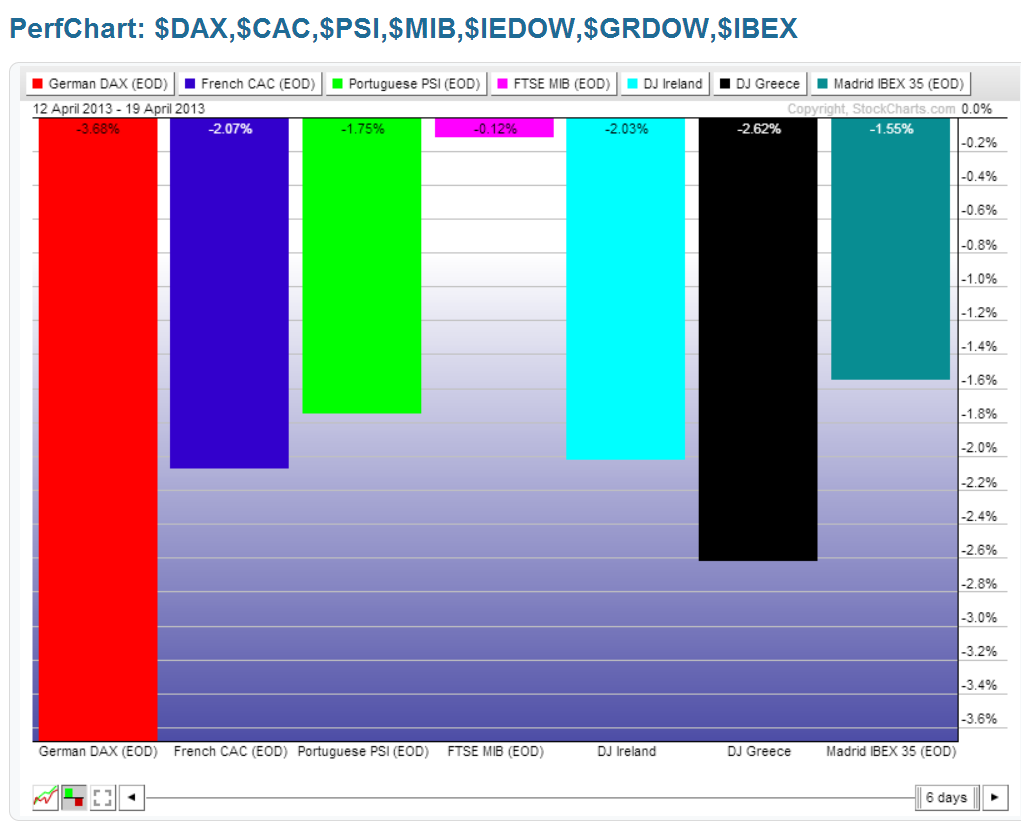
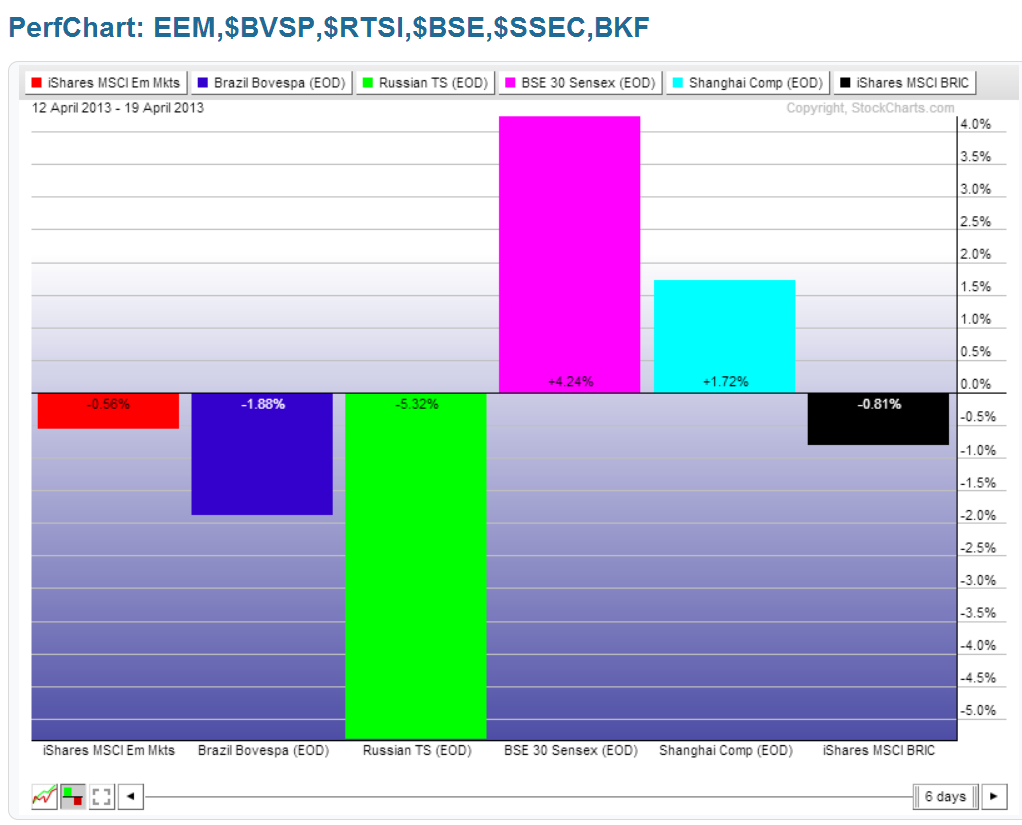
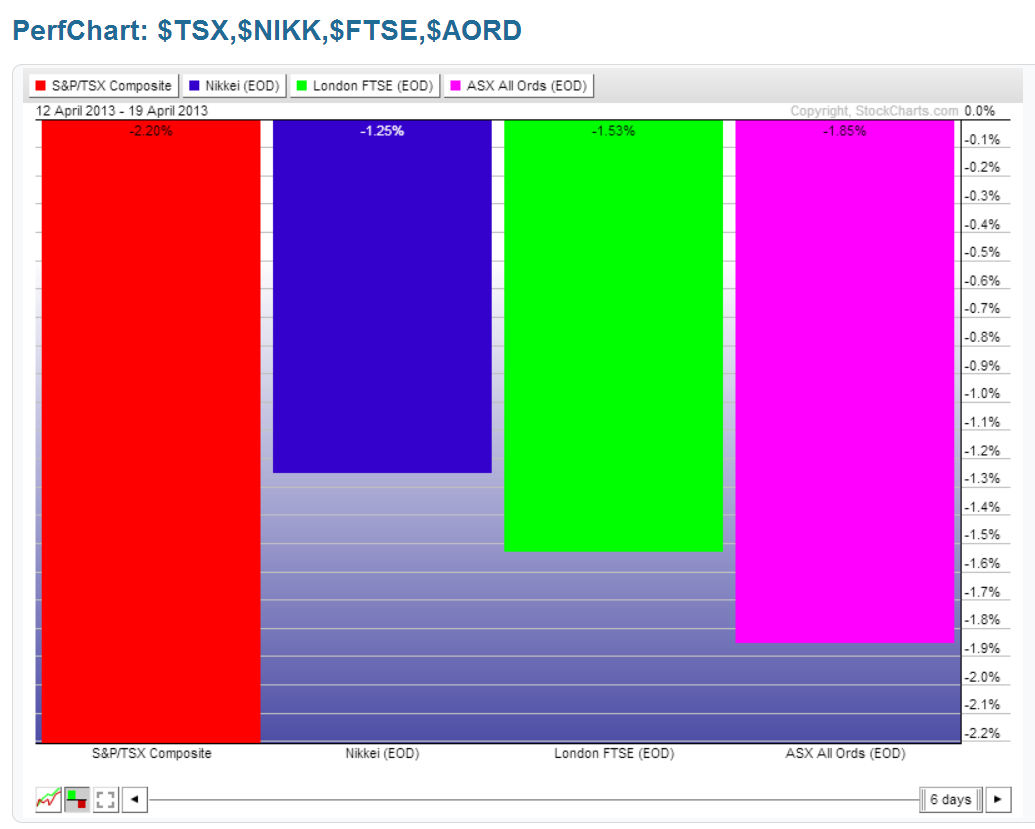
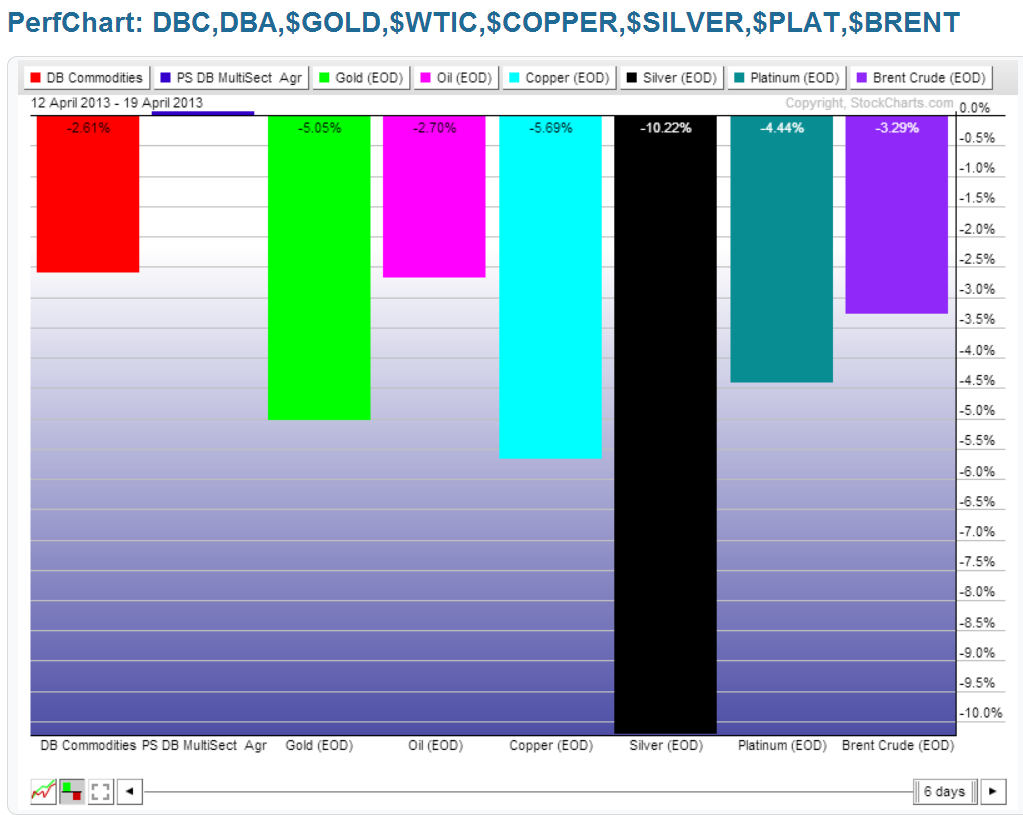
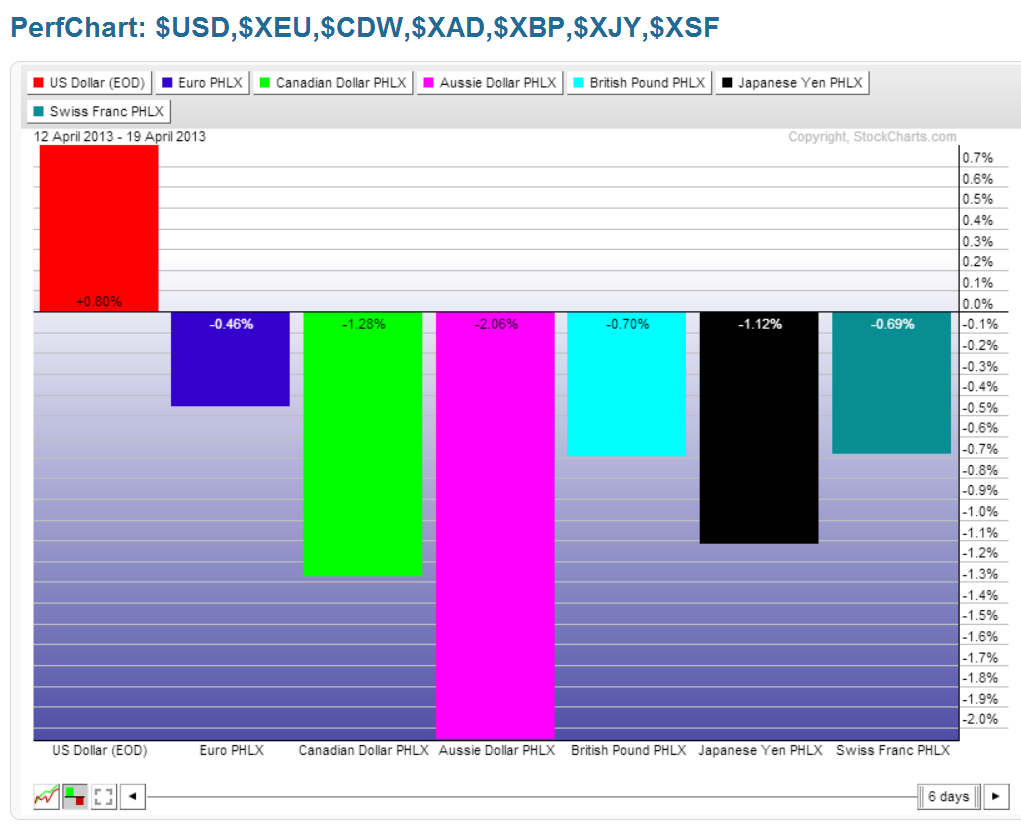
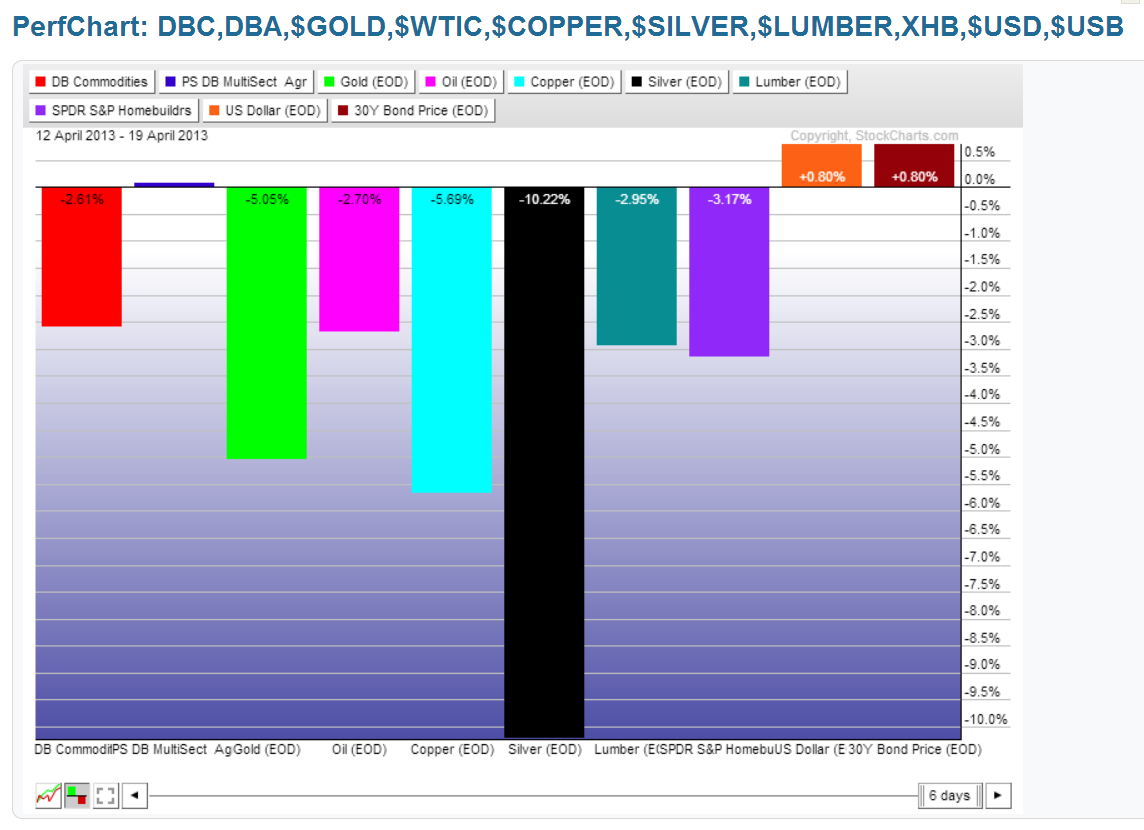
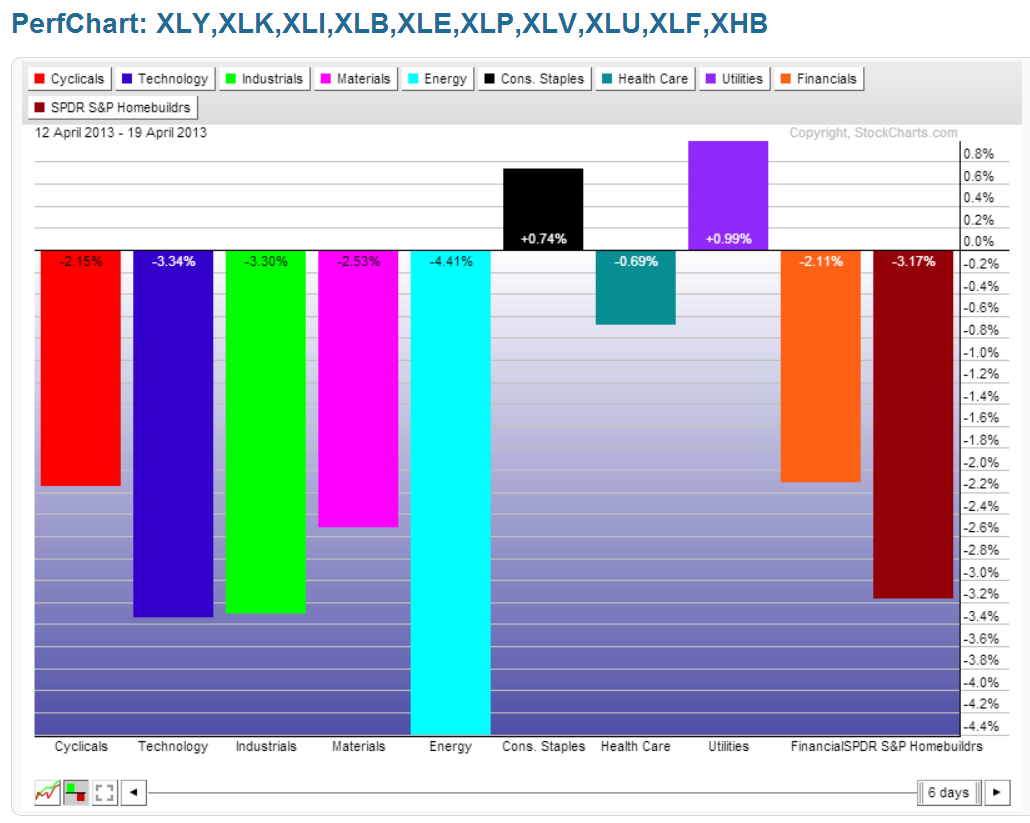
- Nine 1-Week percentage gained/lost graphs of these markets (you can see which markets gained/lost this week, and by how much)
- Three Monthly charts of Lumber, Copper, and the Homebuilders ETF (XHB)
As you can see, this is a different format than I usually produce for these weekly summaries. With respect to items 1 and 2 above, I'll simply post each chartgrid, followed by its corresponding graph, without commentary. With regard to item 3, I'll provide some comments just before the three charts on those instruments.
What I will say, is that on the Item #1 charts, I would use the 50 ma (red) as a rough guide to act as the general daily trend and support indicator. When price is below that moving average, it is subject to 'bearish' influences, particularly in those instances where the 20 ma (blue) has crossed below the 50 ma. In that case, I'd look for areas of support below the 50 ma that would be formed by trendlines, prior consolidations, and a series of previous swing highs/lows, etc. From that, you can see how much further downside is available compared to potential retracement to the 1-year highs. Of course, on those charts where price is at a 1-year low, you'd have to bring up additional longer-term charts to see where you'd find potential support levels...this is not something I've done in this exercise.
My purpose today is simply to show you, at a quick glance, where world markets are, whether they are in 'bull' (above the 50 ma) or 'bear' (below the 50 ma) territory, if any are still making new 1-year highs, and how far others have pulled back from their highs. This shows which areas are stronger and may continue to show leadership going forward, and, if they do, we may see those areas which have weakened considerably begin to rally. Otherwise, a continued drop in the weaker issues may, finally, weigh negatively on all markets to produce a larger, more general, pullback, or even a correction.
In general, it appears that the U.S. $ and 30-Year Bonds are still considered to be the 'safe-haven' plays. 

The next three Monthly charts show resistance and support levels on Lumber, Copper, and the Homebuilders ETF (XHB). Lumber and XHB have pulled back somewhat after hitting major resistance levels. Copper has been much weaker and is approaching one major support level at 3.00. If Copper falls and holds below 3.00, it may have a negative impact on Lumber and XHB. And, vice versa, if Lumber and XHB continue to drop, we may see Copper decline below that level down to its next major support level at 2.50.
As an aside, I'd have to say that a good part of the increase that we've seen in new home prices since the 2009 lows is likely due to the increase in the price of Lumber (which has been approaching historical 25-year highs) (and Copper, to some extent, which hit an all-time high in 2011). We'll see if new home prices (and sales) continue to rise if we see a meaningful decline in these three issues, as well as in the Financials Sector.
These three instruments (including Financials) are worth watching going forward, along with Commodities, as I've written about recently here, here, here, and here, since further weakness in these may markedly negatively influence equities. As well, further weakness in European instruments, particularly their banks, along with the BRIC countries/ETF and Emerging Markets ETF, may negatively impact U.S. equity markets.

