STOCKS:
As 2012 begins, very little has changed from the end of 2011: the European debt contagion remains in place and is growing, China remains on a growth deceleration curve — while the US is showing stable, albeit it very low growth. What is clear to us, is that at this point — the US is better positioned than the rest of the world, which simply means that it shall outperform yet again this year.
STRATEGY: Technically speaking, the S&P 500 remains above longterm support at the 45-mema at 1190; which is critical given it delineates bull & bear markets. Now, given this is the beginning of the year, we’ll look for portfolio reallocations to dominate this first week of trading, which is bullish for the time being as stocks are rising and bond prices are declining. BUT...Europe will continue to dominate the news.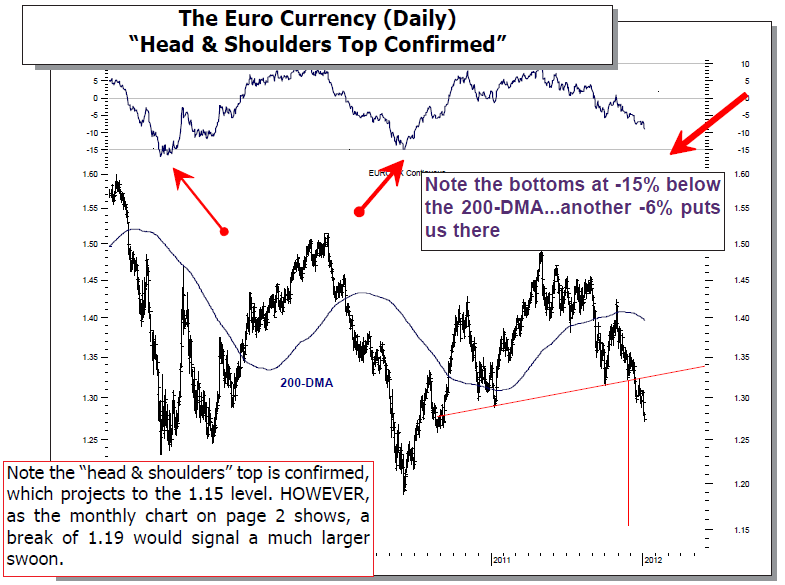
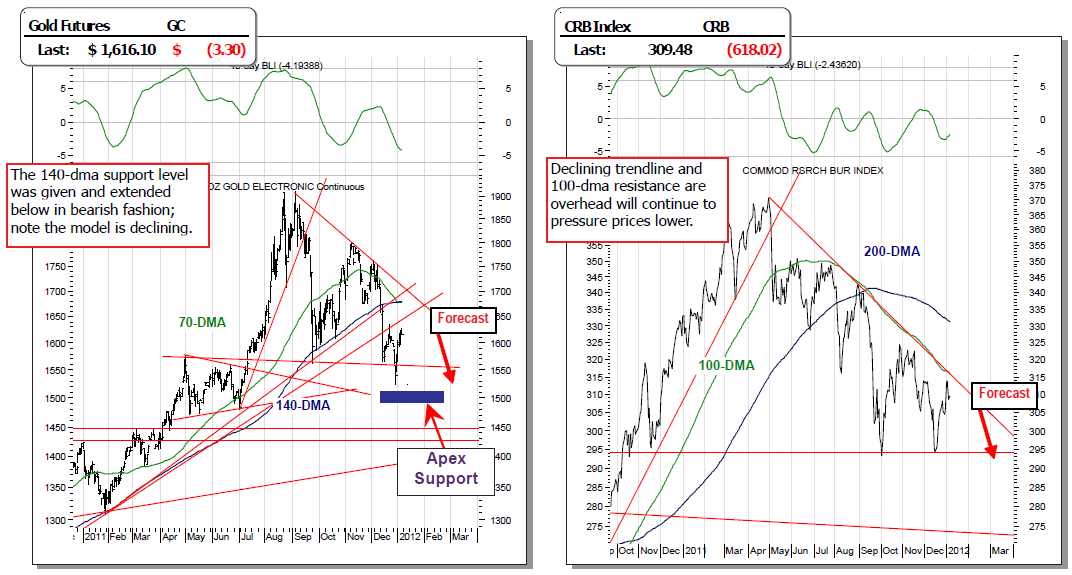
WORLD MARKETS ARE “MIXED” AS WE BEGIN THE NEW WEEK: First, let us note that Asian bourses rallied overnight on hopes that the Chinese would implement another round of financial and monetary stimulus. This prompted China’s Shanghai Index to rally nearly +3.0%; a figure we don’t find unreasonable given that the index has fallen over -18% since mid-November. Hence, we look upon this as being nothing more than stabilization of an oversold situation.
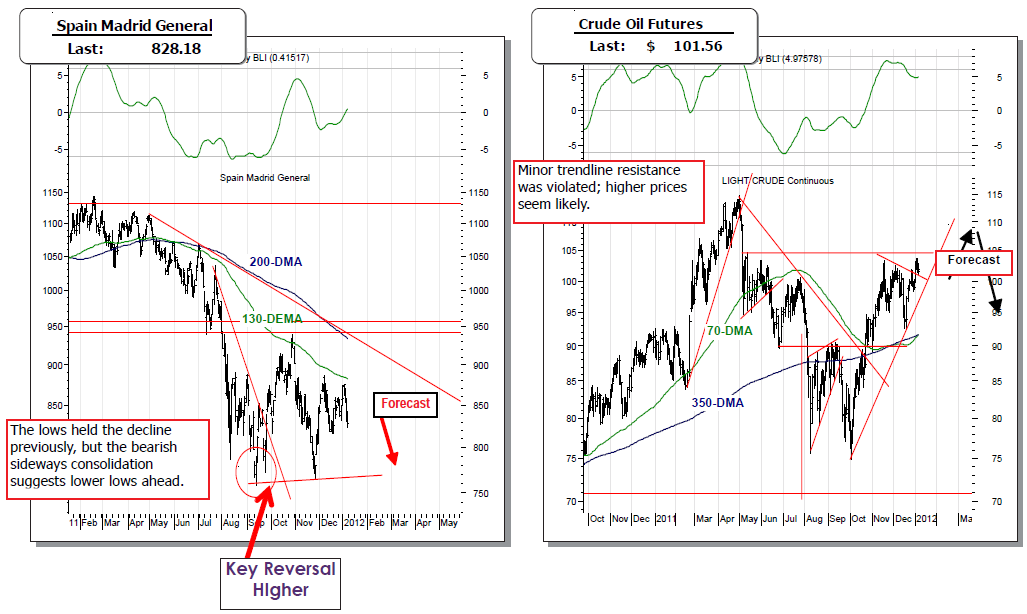
Moving on, European and US early morning futures trading is hinging upon the outcome of another Merkozy meeting that supposed to have already concluded and a statement given. There isn’t anything of the sort at present, and one could look upon this as being there are severe dis agreements again…or they are hashing out the details of a more comprehensive plan. We’re not as optimistic, for Ms. Merkel is seeking structural changes – and isn’t up for re-election until mid-2013 and has a 65% approval rating – all the while that Germany is no considered to be in recession; while Mr. Sarkozy is seeking more short-term market oriented changes – and is 8 points behind in a recent poll, and is up for reelection on April 22nd.
The Euro for its part is modestly higher after having traded the overnight session lower; and it rose based on China stimulus. We have included a chart of the Euro on both page one and two today to show that the daily and monthly technicals behind the Euro that could turn out to be quite dour indeed. Today, Mr. Soros in comments from Bangalore, India, said 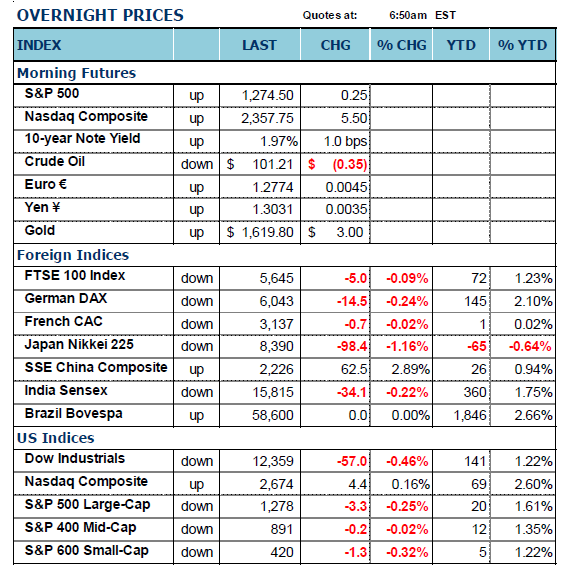
Thereafter, we’ll allow our short S&P 500 position to remain in place using a buy stop; and we’ll look upon the S&P failing below the 1255-to-1260 zone as being sufficient to add further short positions in both our Short List and our Model Portfolio.
NOTE: Please bear with us (no pun intended) over the next week as our readership will notice various changes to our report. These changes are a reflection of RCM more closely linking our model portfolios to our client managed account offerings. This allows potential clients to get a clearer view of our methodologies and performance. Therefore, this means the following for the TRR model portfolio:
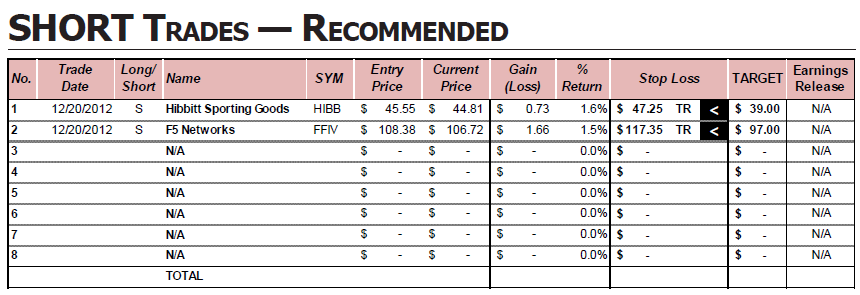
1. The Rhodes Discretionary Model Portfolio will include inverse and inverse/ leveraged ETFs on the broad market in lieu of individual stock short positions. This is the manner in which we manage our clients’ accounts; which only makes practical sense. 2. Short positions in individual stocks will not part of the model portfolio; they will be listed in a short recommendation section that will allow traders to trade individual short positions if they so choose. They simply won’t be part of the model portfolio. All relevant trade information shall be included in the section.
3. A section for long positions is also being added; and it shall hold perhaps more long positions than the model portfolio holds. There are various stocks we believe that are worthy of trading that we may or may not include in the model portfolio simply because it may cause the portfolio to be far more over-weight in long positions than practical. This is in deference to our more aggressive traders.
Collectively, we believe the changes to the reports will benefit all of our audiences from potential to current clients; and those traders that aren’t interested in model portfolios. Moreover, it makes common sense from the perspective of managing our business. We understand there may be questions and if so…please just email us and we’ll get back to you ASAP.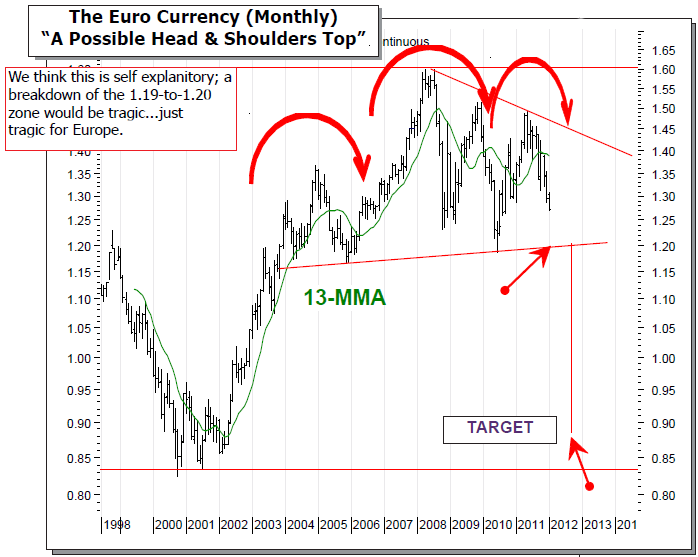
he believes that the current sovereign debt situation is worse than 2008. If Mr. Soros is concerned…then we should be as well.
Lastly today, we have the beginning of the 4Q-2011 earnings season tonight with the release of Alcoa’s (AA) earnings. Over the past year, AA has not produced anything considered positive in its earnings that relates to the market overall. However, we should note that earnings growth is at its lowest point in 2-years and estimates are being taken down daily.
TRADING STRATEGY: Today we shall once again get long Volatility (VXX), and will do so given the a myriad of fundamental and technical reasons. And, we shall keep a bit wider stop on this position as we move into next week’s Italian bond auction given its yields stand at 7.10%...above the 7.00% threshold for pain. For now, the market believes in a pan-European solution, but we believe they shall continue to dither until the market inflicts enough pain that they will be forced monetize European debt much in the same manner as the US Fed has done.
MAJOR MARKET FUTURES
MAJOR WORLD RISK POINTS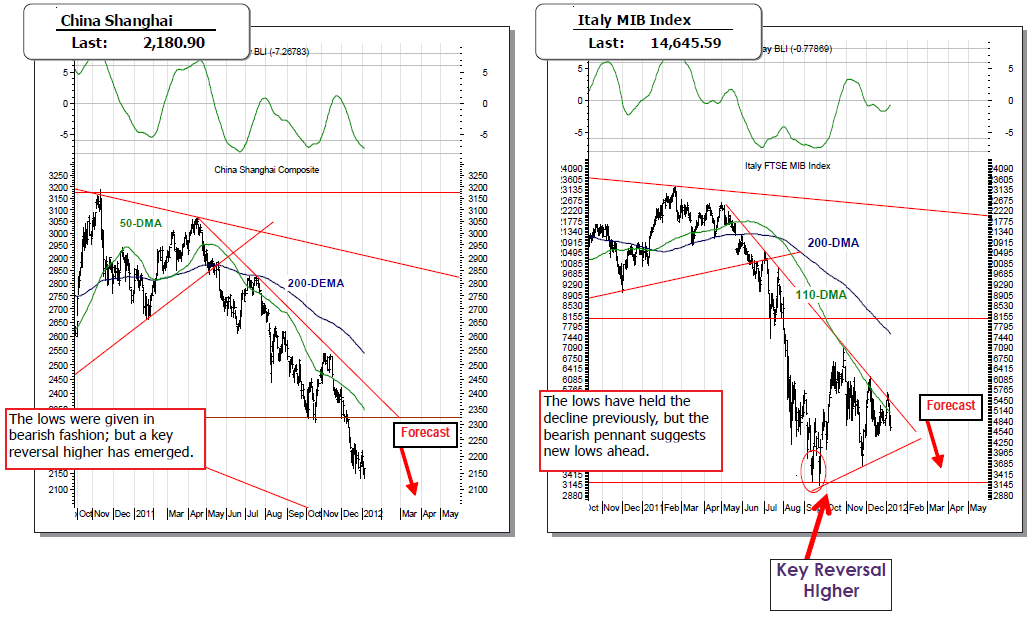
S&P 500 INDEX — TECHNICAL COMMENTS
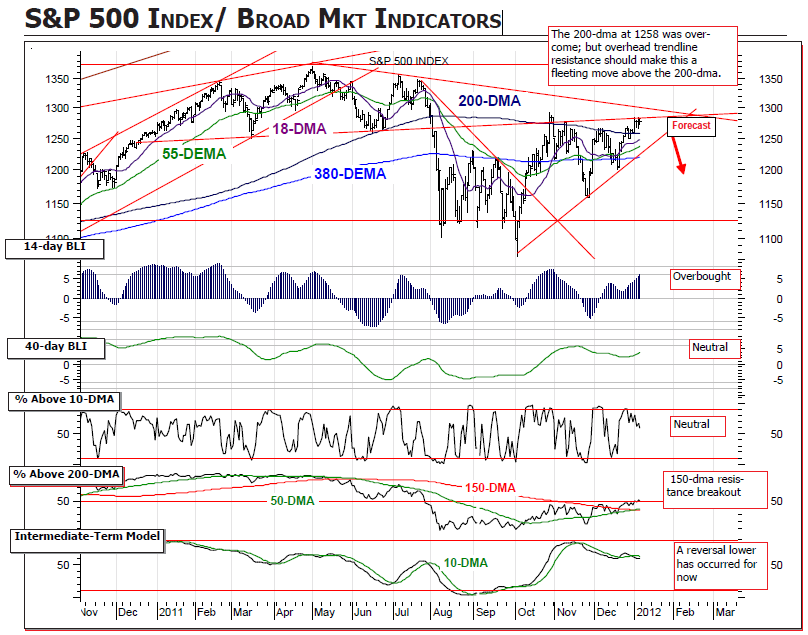
THE TECHNICAL PICTURE IS AT A VERY CRITICAL POINT The S&P bullish key monthly reversal to the upside remains in place — which stands important given the important 55-dema/380-dema levels at 1220 were regained. Now, the bulls have pushed prices higher above the 200-day moving average at 1258, but on diminished volume and more importantly...less conviction given the advancing volume to declining volume figures.
We’ve needed to see several days of strong trade above this level to get long as this isn’t an “all or none” situation given the beginning of the year rellocation noise. But, we haven’t seen it yet, with several overhead trendline resistance levels crossing between 1280 to 1300. We expect them to prove their merit with lower prices to be sure.
TECHNICAL INDICATOR REVIEW:
The 14-day is now at overbought levels, while the 40-day appears to be forming a bearish ledge.
The % of stocks above their 10-day moving average is correcting from overbought levels.
The % of stocks above their 200-day moving average stands at 49%...down -1% from the prior close. The 150-dma was violated to the upside in bullish fashion...a positive.
The Intermediate-term Model has now turned nascently lower through its 10-dma, which given the recent breakout suggests the prior break higher is inconclusive at this point.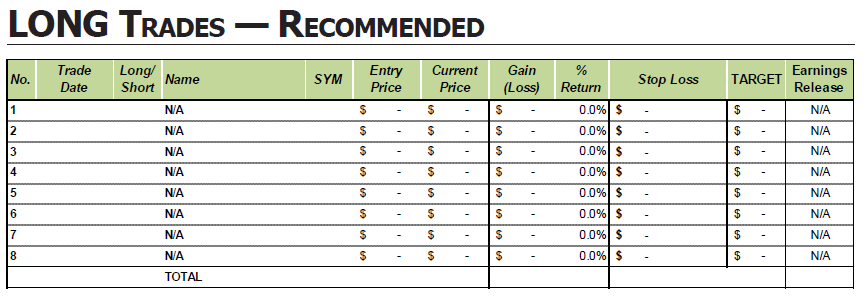
STOCKWATCH – POTENTIAL LONGS I
STOCKWATCH – POTENTIAL SHORTS I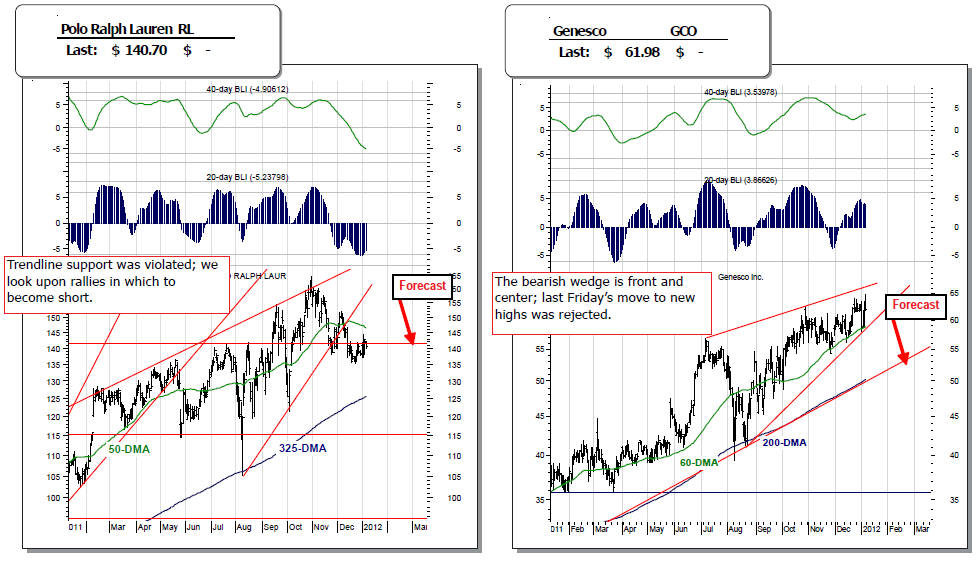
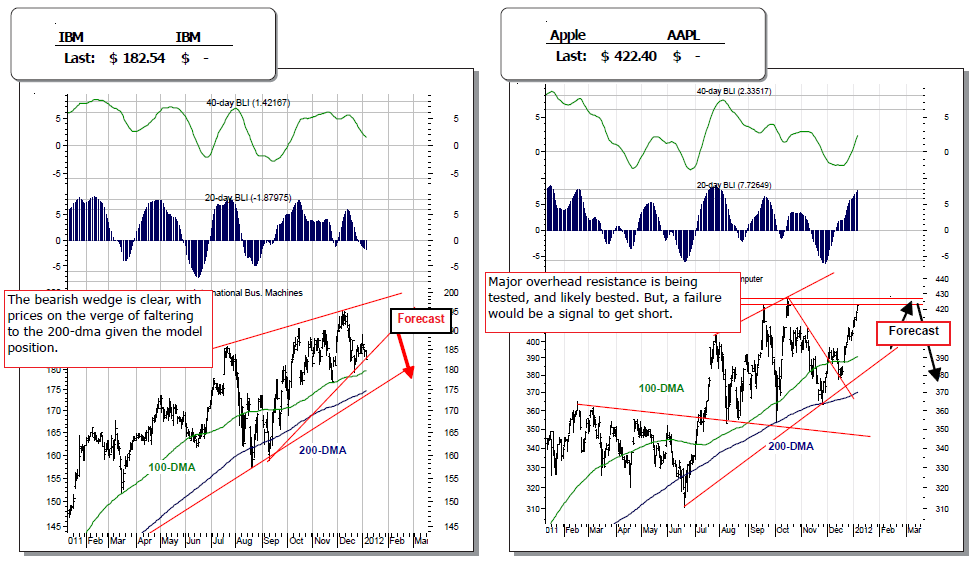
SHORT POSITIONS I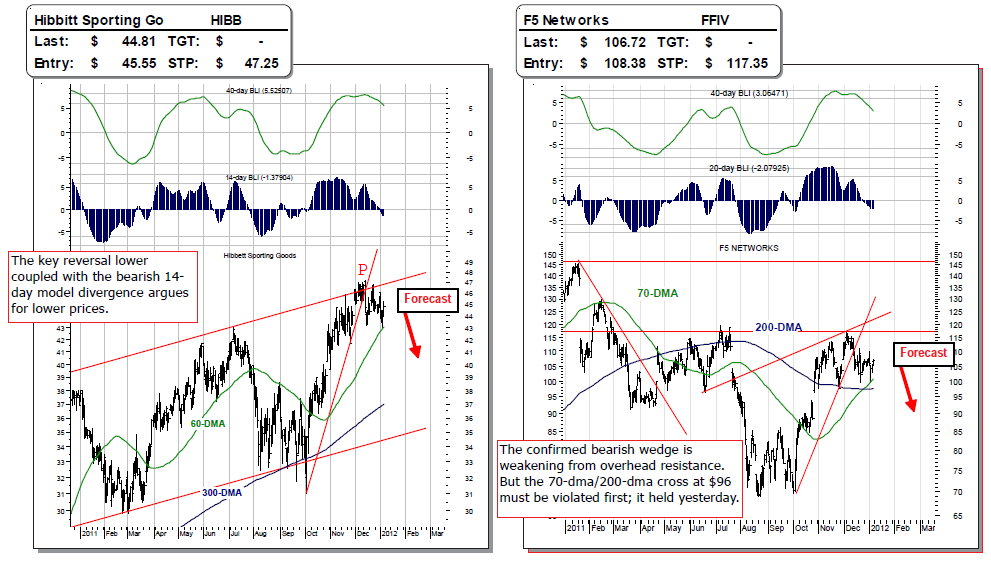
To read the entire report please click on the pdf file below.
