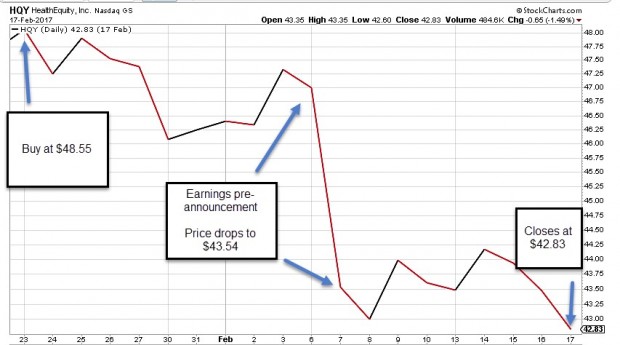
A critical BCI rule for covered call writing is never to sell an option if there is an upcoming earnings report prior to contract expiration. Earnings reports are risky events we want to avoid. From time-to-time a company will pre-announce earnings especially if there will be a negative story to tell its shareholders when the report is due out. Unlike the report itself, we cannot know the date of this disclosure and may experience significant share decline depending on the market reaction. In February, 2017, Ritchie sent me an email of a paper-trade he executed that reflected such a scenario.
Ritchie’s trade
- 1/23/2017: Buy Healthequity Inc (NASDAQ:HQY) at $48.55
- 1/23/2017: Sell the February, 2017 $50.00 call for $1.45
- 2/7/2017: HQY gaps down to $43.54 as a result of an earnings pre-announcement
- 2/17/2017: HQY closes at $42.83 at contract expiration
Here is a chart showing the price movement of HQY from start to finish of the February, 2017 contract:

Once the unexpected gap-down occurs, we can check various sites like finviz.com to research the reason for the price decline.
Ritchie’s initial returns using the multiple tab of the Ellman Calculator

Ritchie took a bullish position with this trade generating an initial 1-month time value return of 3% with an opportunity of an additional 3% of upside potential. There was a possibility of a 6% 1-month return.
Exit strategy opportunity
Using the 20/10% guidelines we buy back the option and look to either roll down or sell the stock. Let’s look at a roll down to the $43.00 strike:
- 2/7/2017: BTC (buy-to-close) the $50.00 call at $0.05
- 2/7/2017: STO (sell-to-open) the $40 call at $4.40
- 2/17/2017: Allow assignment and shares are sold for $40.00
Share loss if options were not sold
Shares were purchased at $48.55 and price declined to $42.83 at contract expiration. This represents an unrealized loss of $572.00 per contract…ouch!
Mitigating losses with options
Shares were sold at $40.00 representing s loss of $855.00 per contract…double ouch!! HOWEVER, we have options credits so let’s calculate:
$145.00 (-) $5.00 +$440.00 = $580.00. This represents a net realized trade loss of $275.00 per contract. Now, losing $275.00 per contract is no reason to break out the champagne but it is a lot more palatable than a loss of twice that amount had we not written options and used our management skills to mitigate this loss.
Market tone
Global stocks moved to all-time highs midweek before backing off slightly ahead of the weekend. Oil gained ground amid uncertainty surrounding Saudi Arabia and Venezuela, climbing to $57.20 per barrel from $54.60 last week. Volatility, as measured by the Chicago Board Options Exchange Volatility Index (VIX), rose to 11.21 from 9.5 last week. This week’s economic and international news of importance:
- The US House Ways and Means Committee, the tax-writing arm of the lower house, amended the tax reform proposal it put forth last week. The Senate Finance Committee unveiled its plan for the first time on Thursday. Among the key differences is the effective date of the proposed corporate tax cut from 35% to 20%
- According to the White House, $250 billion in trade deals were agreed during Donald Trump’s visit to Beijing. Skeptics noted many of the announced deals were not contractual obligations and some may have been agreed previously
- The US Federal Reserve will have all-new leadership as Janet Yellen’s term as chair expires in February. President Trump has nominated Fed governor Jerome Powell to succeed Yellen as chair
- Peoples Bank of China governor Zhou Xiaochuan warned again this week that his country’s financial system is becoming significantly more vulnerable because of high leverage
- Bullish sentiment is at its most elevated level in three decades. According to Investors Intelligence, 64% of newsletter writers were bullish this week, versus just 14% who were bearish. The spread between bulls and bears has been at an elevated level for six straight weeks
- Another sign of market confidence is a record level of margin debt, according to the Wall Street Journal. Margin loans grew 14% from the end of 2016 through the end of Q3
- With 90% of the members of the S&P 500 Index having reported for the third quarter, blended earnings grew 6% versus the same quarter a year ago. Stripping out insurance companies, which were hit by hurricane claims, earnings rose 8.3%
- Revenues rose 5.8% year over year
THE WEEK AHEAD
Mon Nov 13th
- None
Tue Nov 14th
- China: Retail sales and industrial production
- UK: Consumer price index
- Eurozone: Q3 gross domestic product
Wed Nov 15th
- UK: Unemployment rate
- US: Retail sales, consumer price index
Thu Nov 16th
- UK: Retail sales
- Eurozone: Consumer price index
- US: Industrial production
Fri Nov 17th
- US: Housing starts, building permits
- Canada: Retail sales, consumer price index
For the week, the S&P 500 dipped by 0.21% for a year-to-date return of 15.34%
Summary
IBD: Market in confirmed uptrend
GMI: 5/6- Buy signal since market close of August 31, 2017
BCI: My portfolio makeup reflects a slightly bullish bias, selling 3 out-of-the-money calls for every 2 in-the-money calls.
WHAT THE BROAD MARKET INDICATORS (S&P 500 AND VIX) ARE TELLING US
The 6-month charts point to a neutral outlook. In the past six months, the S&P 500 was up 8% while the VIX (11.21) moved up by 8%.
Much success to all,
