Our cycle and predictive modeling solutions have been suggesting that Mid-August 2019 will likely prompt a major inflection point in the U.S. stock markets. Our continued efforts to identify this big breakdown price move in term of timing and expected range have led us to believe the outcome could be at least a -10% to -13% downside price collapse – possibly larger.
Our research team now believes that August 19 (+/- 5 days) will likely be the critical price inflection point/price apex that we have been searching for. Our cycle and other predictive modeling tools are suggesting that this date will become critical for the markets future price trends and current support/resistance levels. We believe that some type of new event or price event will take place sometime between August 14 and August 19 and that this event will lead to a new bearish price trend setup to break current support levels as well as begin a downside price move that should attempt a minim of -10% to -13% before attempting to find support.
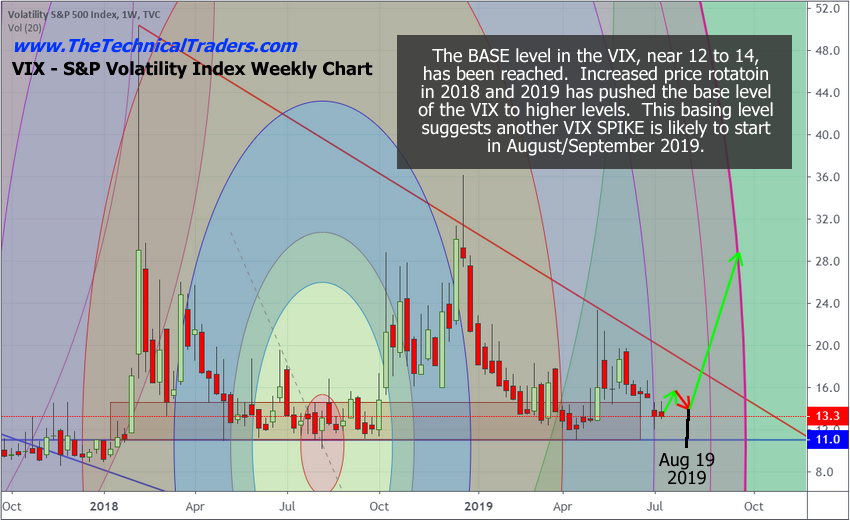
This VIX Weekly chart highlights our expectations with regards future VIX activity and the initiation of the VIX SPIKE that will coincide with our expectations of a price collapse in the US stock market. We believe the VIX level will continue to move moderately higher over the next two to three weeks before the August 19 date – possibly as high as 16 to 18. We believe the VIX will begin the spike move from levels near 14 to 16 (just before August 19).

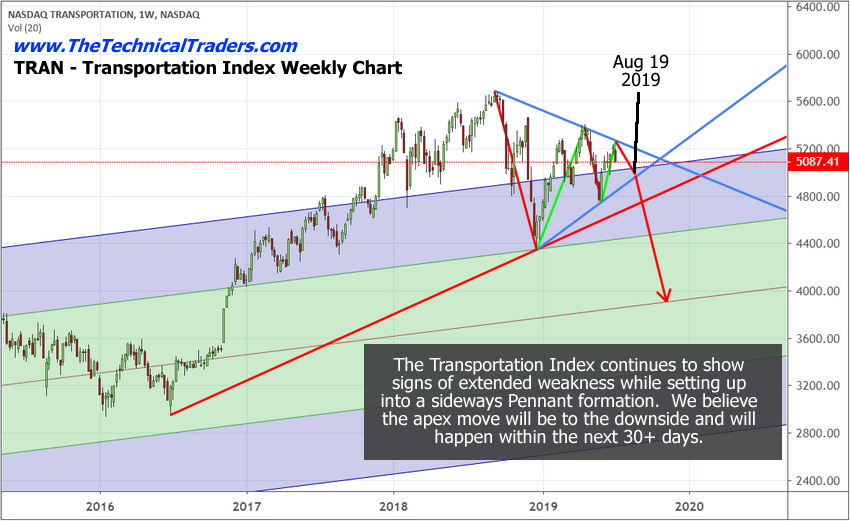
This TRAN weekly chart clearly shows the Pennant formation (BLUE LINES) and the critical price support channel (Upward sloping RED LINE) that we believe are critical to the future outcome of this breakdown price move setup happening on August 19, 2019.
First, the price must attempt to reach the Apex of the Pennant formation, then attempt a breakout/breakdown move. We believe the breakdown move is the higher probability outcome of this Pennant formation based on technical and price pattern details.
Once the breakdown move begins, price support near the price channel (RED LINE) will become critical as a future support level. If that level is broken, then we believe the TRAN may attempt to fall to levels near the middle of the Standard Deviation price channel range – near $4000.

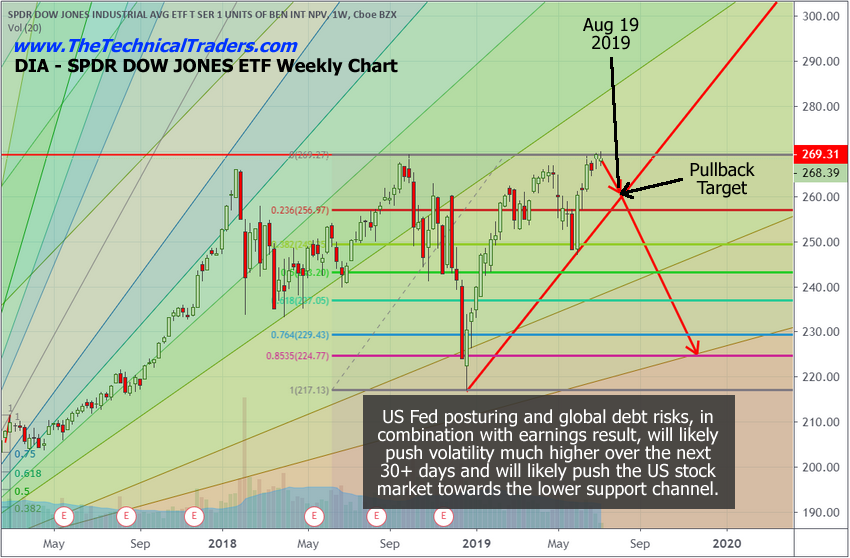
This DIA Weekly chart shows a similar price pattern, although the Pennant formation is a bit harder to see. The Pennant formation on this DIA chart is set up across the Double Top price level, near $269.50, and the upward sloping price channel line (RED LINE). The 2018 deep price low sets up “leg 1” and we believe we have completed “leg 4” of this Pennant formation already. This leads us to believe the Double Top formation in conjunction with our other research components suggests the markets are currently setting up for a sideways/rounded top formation over the next 20 to 30+ days before beginning a moderate breakdown price move headed into August 19, 2019.
We believe there is a strong possibility that the key psychological levels ($300 SPY (NYSE:SPY), $3000 ES and $30k INDU) are likely to be breached throughout this Q2 earnings season. We believe that key psychological price level may be the “trigger point” for an immediate price reversal and the beginning of the setup for our expected August 19 price collapse.

We urge traders to understand the risks that are currently prevalent in the markets as prices continue to trade near all-time highs. Our suggestion would be to pull 40% to 60% off the top right now (or at least before early August) in preparation for this next price rotation.
Watch the US Dollar, Gold, Oil and the Transportation Index for signs of weakness that may erode price support before the August 19th date.
