
MetLife, Inc.’s (NYSE:MET) third-quarter 2016 earnings of $1.28 per share surpassed the Zacks Consensus Estimate of $1.14. Earnings were up from 62 cents per share reported in the year-ago quarter.
MetLife generated operating revenues of $18.1 billion. The top line surpassed the Zacks Consensus Estimate of $16.93 billion and increased 1% year over year.
MetLife’s premiums, fees and other revenues slipped 1% year over year to $13.1 billion.
During the reported quarter, MetLife’s total expenses increased 8.2% year over year to $17.2 billion.
Segment Details
U.S.
Operating earnings in this segment increased 8% year over year to $552 million. Operating return on allocated equity was 20.4% and operating premiums, fees & other revenues declined 1% to $6.4 billion.
Asia
Operating earnings were down 4% (or 11% on constant currency basis) year over year to $324 million. Operating return on allocated equity was 11.7%. Operating premiums, fees & other revenues in Asia increased 4% (down 9% on a constant currency basis) to $2.2 billion.
LATIN AMERICA
Operating earnings were $133 million, down 27% (23% on a constant currency basis), mainly due to the effects on the year-over-year comparison of a one-time tax benefit of $60 million in the third quarter of 2015. Operating return on allocated equity was 17.3%. Operating premiums, fees & other revenues were $891 million, up 4% (12% on a constant currency basis).
EMEA
Operating earnings from EMEA increased 12% (or 19% on constant currency basis) year over year to $74 million.
In the reported quarter, operating return on allocated equity was 9.2%. Operating premiums, fees & other revenues were $621 million, almost unchanged from the prior-year period and up 3% a constant currency basis, driven by growth in employee benefits and accident & health.
Investment & Financial Update
In the reported quarter, net investment income increased 6% year over year to $5.2 billion. Variable investment income was $409 million, up 53.2% year over year. This increase was driven by the strong performance of private equity and the sale of a real estate joint venture interest.
Operating return on equity increased 11.8% from 6.1% in the year-ago quarter.
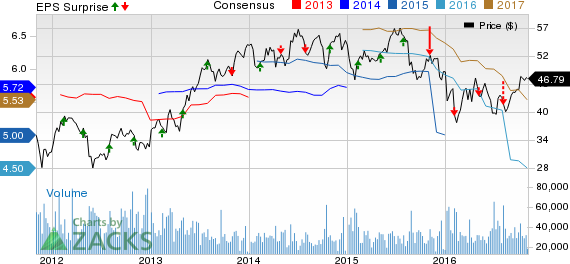
METLIFE INC Price, Consensus and EPS Surprise
Zacks Rank
Currently, MetLife carries a Zacks Rank #3 (Hold). You can see the complete list of today’s Zacks #1 Rank (Strong Buy) stocks here.
Performance of Other Multi Line Insurers
The bottom line at Lincoln National Corp. (NYSE:LNC) and CNO Financial Group (NYSE:CNO) beat the respective Zack Consensus Estimate but American International Group Inc. (NYSE:AIG) earnings missed the same for the third quarter.
Confidential from Zacks
Beyond this Analyst Blog, would you like to see Zacks' best recommendations that are not available to the public? Our Executive VP, Steve Reitmeister, knows when key trades are about to be triggered and which of our experts has the hottest hand. Click to see them now>>
LINCOLN NATL-IN (LNC): Free Stock Analysis Report
AMER INTL GRP (AIG): Free Stock Analysis Report
METLIFE INC (MET): Free Stock Analysis Report
CNO FINL GRP (CNO): Free Stock Analysis Report
Original post
Zacks Investment Research