Over the moderately quiet 2019 Christmas holiday season, while the U.S. and global stock markets continue to push higher, precious metals and miners have begun to move dramatically higher as fear settles into the markets. Our researchers believe this upside move in metals and miners represents a measured increase in investor concern related to early 2020 and the global economy.
Our research team thinks the current rally in the U.S. stock market is an enthusiastic upside price move that does not have true fundamental support. We've authored a number of articles and research posts that highlight our belief and we suggest this upside move in gold and miners is a sign of underlying fear that is growing in the global markets.
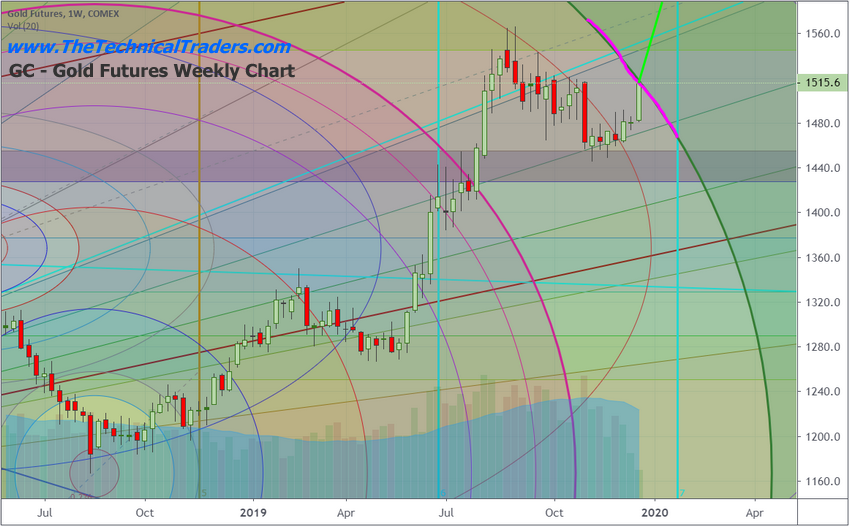
This weekly gold chart highlights our proprietary Fibonacci Price Amplitude Arcs and the recent downside price move in gold along the Red Fibonacci Price Arc. This level of resistance was recently broken in early December and the current upside price rally in gold has already rallied up to the heavy Green Price Arc. This current Green Price Arc should act as a major resistance level in an uptrend. Once this level is broken, it is very likely that gold will continue to accelerate higher – well beyond the $1600 price level.
Should gold rally above $1600, possibly targeting $1750 or higher, in early 2020, a shock-wave would sound across the globe that Metals are signaling absolute fear in the markets. If our expectations are correct, $1750 will be one of the first basing areas for gold before a move to levels well above $2000.

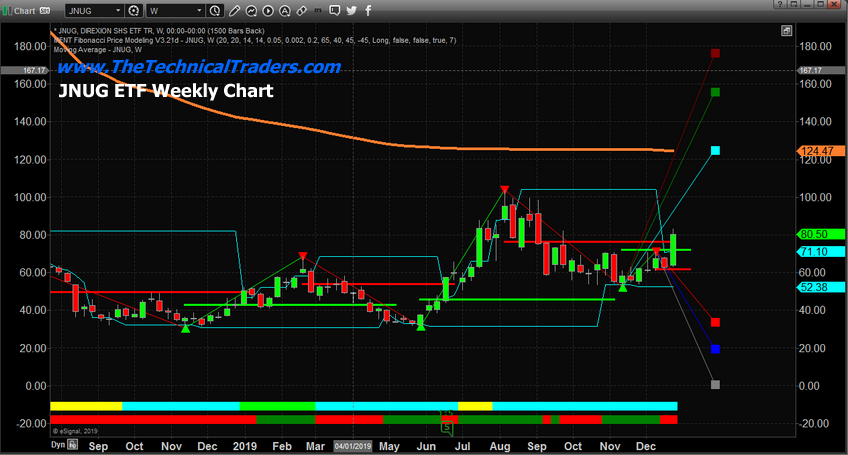
This weekly JNUG chart highlights our Adaptive Fibonacci Price Modeling system and clearly shows the upside potential/targets base on Weekly price rotation. The bottom setup near $52.40 in early November sets up a price range from the peak in early August to the bottom in early November. This range suggests an upside price rally may take place in JNUG that targets $124.50, $155.65, and $176.00. These levels are based on the adaptive Fibonacci price theory applied to the expanding price rotations over the past 2+ years.
As you can see from this chart, the recent rallies on this chart are bigger and include more price volatility than previous moves. This range expansion suggests upside price targets based on Fibonacci theory will be 1x or 2x traditional 100% measured moves.

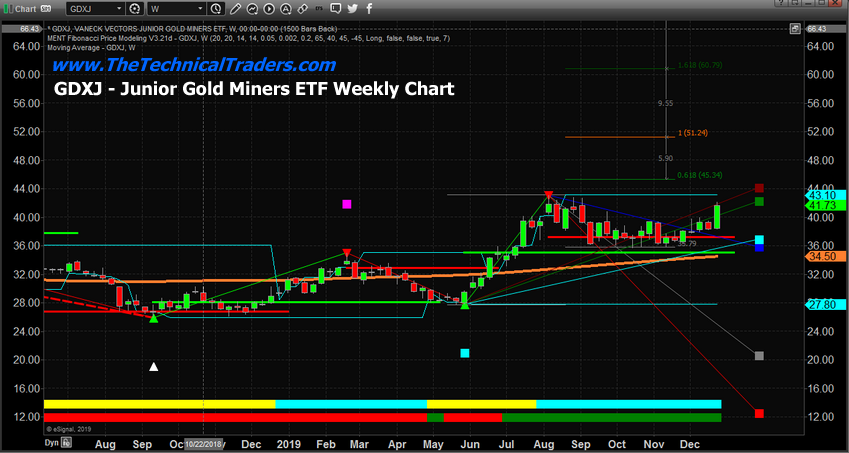
This weekly GDXJ chart provides a less volatile option for skilled traders to trade this upside price move in Metals and miners. It is very clear to see the upside resistance on this chart near $43.10 and the fact that the current upside price rally bar is targeting that level. Once this level is broken, we believe upside target levels near $46.50, 51.24, and $60.80 are likely. Each of these upside price targets represents a moderately strong upside potential in Gold and is contingent on a strong rally taking place breaking the initial Green Fibonacci Price Amplitude Arc as we suggested near the top of this article.

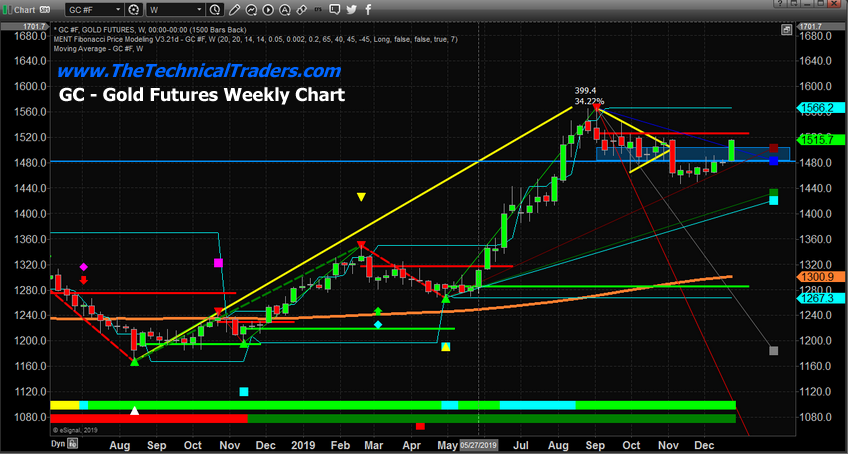
This last weekly chart of gold highlights the Weekly Fibonacci Price Modeling system and the core support near $1480 to $1510 (the Blue Box/Line). This level of support is identified by the BLUE Fibonacci Price Modeling System retracement target (Square (NYSE:SQ)). We believe the breakdown in price after the Pennant/Flag formation in late October was investor/news-driven as the US Fed announced lower interest rates and the new cycle continued to push “US/China Trade Deals Soon” topics. This was a way to settle investor's nerves and distract them from the underlying market dynamics.
Now, 2+ months later and about to start into 2020, we believe investors are starting to get ahead of the true market valuation levels and understand that precious metals are truly undervalued given the amount of risk in the markets currently.

We believe this upside move in metals and miners is just getting started. We believe a move to levels just below $1650~1700 will be complete the initial upside price leg, then a second upside price leg will push prices upward towards $1800.
You really don't want to miss this big setup/move. Please pay attention to the opportunities that are set up for skilled traders.
