MEMC Electronic Materials, Inc. (WFR) is engaged in the development, manufacture, and sale of silicon wafers. Through SunEdison, MEMC is a developer of solar energy projects. The Company operates in two business segments: Semiconductor Materials and Solar Energy.
This is a stock and vol note in the largest NYSE gainer this morning. Let's start with the news, then move to order flow, stock and vol. Here's a news snippet from yesterday:
MEMC Electronic Materials Inc. (WFR), the second-largest U.S. polysilicon maker, gained the most in almost six months after announcing the sale of four projects in Europe with a total capacity of 98 megawatts.
MEMC completed sales in the second quarter of 60 megawatts of solar farms in Bulgaria and 38 megawatts in Italy, the St. Peters, Missouri-based company said in a statement today. Terms weren’t disclosed. -- Source: Bloomberg via Yahoo! Finance; MEMC Gains on Sale of 98 Megawatts of Projects in Europe, written by Justin Doom.
That snippet doesn't capture the landscape, though. According to an article I read on Seeking Alpha, the company has been in dire straits. Here's a little more news:
Nevada Solar Plant Sold
Late last week, WFR reached a deal to sell its Nevada solar plant to Southern Company (SO) Chairman, President and CEO Thomas A. Fanning and Turner Renewable Energy founder Ted Turner. While the terms of the deal were not announced, the sale should help bolster WFR's capital position.
Debt
One of the biggest challenges facing WFR is the debt load. Currently, WFR has $2.1 billion in debt against $588 million in equity. Given the difficulties facing the company's solar business, the debt to equity ratio makes WFR a risky play.
Short Interest
Short interest in WFR currently stands at roughly 25.12 million or 12.3% of the float. It is possible that some shorts are starting to lock in gains at these levels as WFR has been a real winner for the short sellers. However, it should be noted that the high short interest does create the potential for a short squeeze which seems to be playing out on Monday following recent news. -- Source: Seeking Alpha via yahoo! Finance; MEMC Electronic Materials Leads NYSE, What You Need To Know , written by Sammy Pollack.
It's interesting that the vol has risen off of this news, implying either that the risk of bankruptcy / default was not the only concern here, or that whatever risk this contract(s) has alleviated has been replaced with new risk. More on that in a sec. Lets turn to order flow.
The company has traded over 11,000 contracts on total daily average option volume of just 3,395, with calls trading on an 8.1:1 ratio to puts. The Stats Tab and Day's biggest trades snapshots are included (below).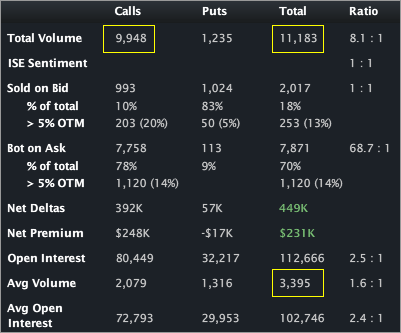
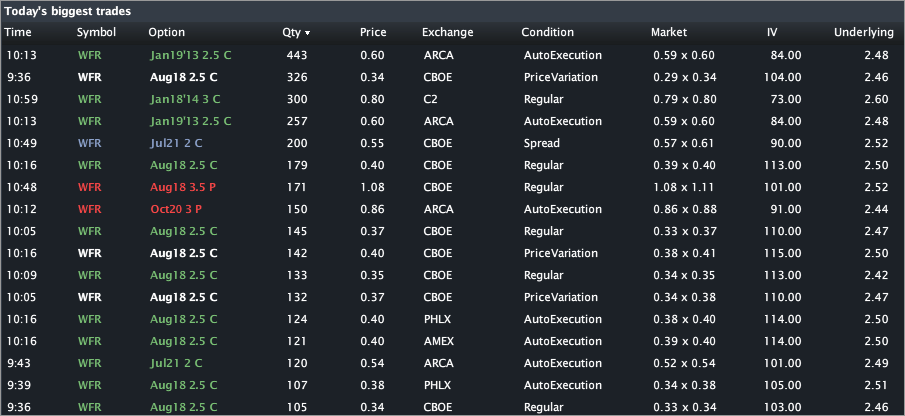
The Options Tab (below) illustrates the action. It looks like the Aug 2.5 calls are showing the greatest volume with over 5,000 having traded in the first two hours on OI of just 151. The action looks to be long those calls, substantially, IMHO.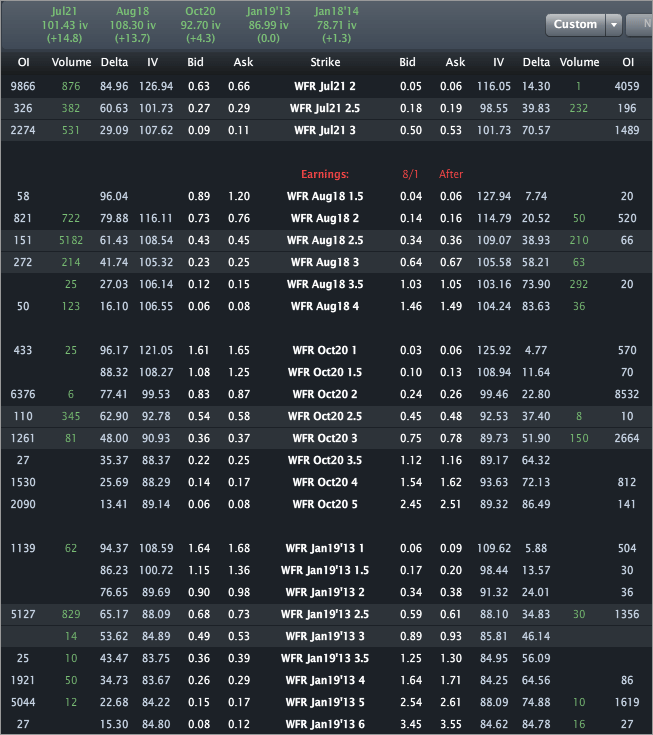
The Skew Tab snap (below) illustrates the vols by strike by month. 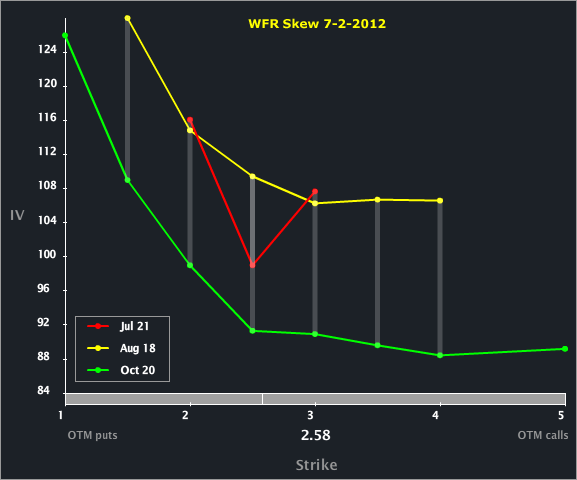
We can see that Aug is substantially elevated to Oct. Last year earnings were released on 8-3-2011, so it's a good bet that an earnings release will occur in the Aug expiry but outside of Jul. That's likely the reason for the elevated vol. Other than that the skew shapes look pretty "normal," with a slight note that the Jul 3 calls are trading at higher vol than the ATM strike, which is sort of backwards and points to the buying pressure today on the call side.
Finally, the Charts Tab (six months) is below. The top portion is the stock price, the bottom is the vol (IV30™ - red vs HV20™ - blue vs HV180™ - pink). 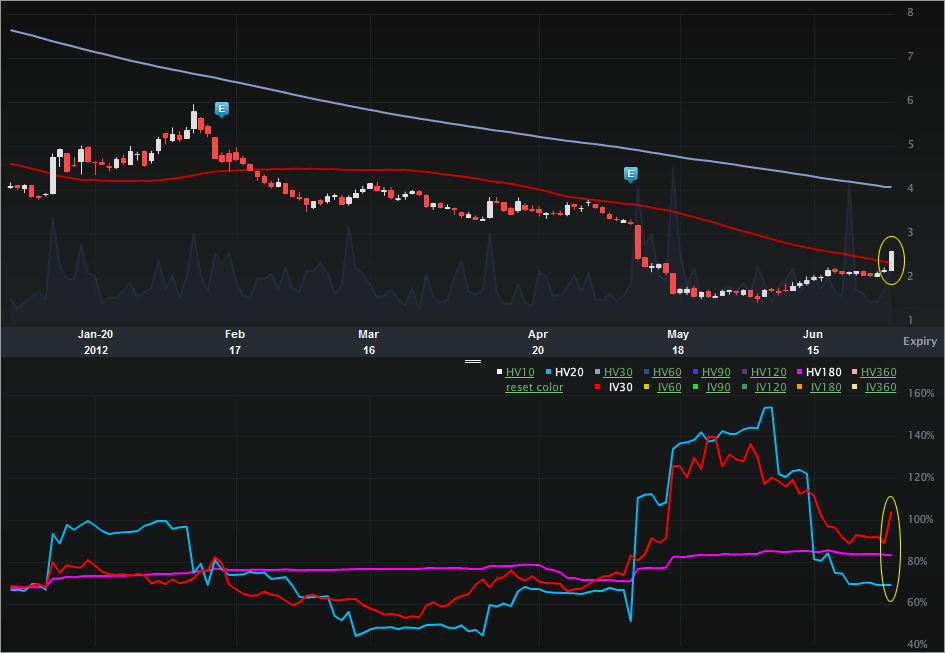
On the stock side, we can see that just ~five months ago this was a $6 stock. We can also see that after the last two earnings reports ("E" icon) the stock dropped on the news, and continued to drop after. The 52 wk range in stock price is [$1.44, $8.64].
On the vol side, we can see how the implied was in fact ~140% less than two months ago, then trailed back down to the ~90% level. The news today has pushed vol back above 100%, but well below the annual high. The 52 wk range in IV30™ is [46.69%, 138.88%], putting the current value in the 62nd percentile. As I mentioned earlier, the rising vol off of this news reflects increased uncertainty (risk), so whatever risk has been alleviated wrt liquidity / default / bankruptcy, has been overshadowed by risk of... something else.
Disclosure: This is trade analysis, not a recommendation.
- English (UK)
- English (India)
- English (Canada)
- English (Australia)
- English (South Africa)
- English (Philippines)
- English (Nigeria)
- Deutsch
- Español (España)
- Español (México)
- Français
- Italiano
- Nederlands
- Português (Portugal)
- Polski
- Português (Brasil)
- Русский
- Türkçe
- العربية
- Ελληνικά
- Svenska
- Suomi
- עברית
- 日本語
- 한국어
- 简体中文
- 繁體中文
- Bahasa Indonesia
- Bahasa Melayu
- ไทย
- Tiếng Việt
- हिंदी
MEMC Stock And Vol Pop; Default Risk Lower But Overall Risk Rises
Published 07/03/2012, 02:05 AM
Updated 07/09/2023, 06:31 AM
MEMC Stock And Vol Pop; Default Risk Lower But Overall Risk Rises
3rd party Ad. Not an offer or recommendation by Investing.com. See disclosure here or
remove ads
.
Latest comments
Install Our App
Risk Disclosure: Trading in financial instruments and/or cryptocurrencies involves high risks including the risk of losing some, or all, of your investment amount, and may not be suitable for all investors. Prices of cryptocurrencies are extremely volatile and may be affected by external factors such as financial, regulatory or political events. Trading on margin increases the financial risks.
Before deciding to trade in financial instrument or cryptocurrencies you should be fully informed of the risks and costs associated with trading the financial markets, carefully consider your investment objectives, level of experience, and risk appetite, and seek professional advice where needed.
Fusion Media would like to remind you that the data contained in this website is not necessarily real-time nor accurate. The data and prices on the website are not necessarily provided by any market or exchange, but may be provided by market makers, and so prices may not be accurate and may differ from the actual price at any given market, meaning prices are indicative and not appropriate for trading purposes. Fusion Media and any provider of the data contained in this website will not accept liability for any loss or damage as a result of your trading, or your reliance on the information contained within this website.
It is prohibited to use, store, reproduce, display, modify, transmit or distribute the data contained in this website without the explicit prior written permission of Fusion Media and/or the data provider. All intellectual property rights are reserved by the providers and/or the exchange providing the data contained in this website.
Fusion Media may be compensated by the advertisers that appear on the website, based on your interaction with the advertisements or advertisers.
© 2007-2024 - Fusion Media Limited. All Rights Reserved.
