Mead Johnson Nutrition Company (Mead Johnson) is a pediatric nutrition company. The Company manufactures, distributes and sells infant formulas, children’s nutrition and other nutritional products.
The news hitting the stock and pushing the vol is of a recall from Wal-Mart after an infant tragically died. Here's the news:
(Reuters) - Mead Johnson (MJN.N) shares fell as much as 12 percent on Thursday following the recall of some of its Enfamil baby formula from Wal-Mart Stores Inc (WMT.N) after the death of a Missouri infant.
Walmart began the process of voluntarily removing the product used by the infant's family
The product is being held pending an investigation by health officials.
A growing number of Cronobacter infections among newborns has provided compelling evidence that milk-based powdered infant formulas have served as the source, the department said in a statement.
"The batch of our product used by the child's family tested negative for Cronobacter when it was produced and packaged, and that has been reconfirmed from our batch records following this news," Mead Johnson spokesman Chris Perille said.
Even if the product was not tainted, the Enfamil brand is likely to suffer, analysts said.
"Until the issue is resolved - and even for a period of time after - we would expect weak Enfamil sales," said JP Morgan analyst Ken Goldman in a research note. "The question is how bad and how long the perception of tainted formula - right or wrong - will last in the public's mind."
Source: Reuters via Yahoo! Finance: Mead Johnson sinks after Wal-Mart recall. Reporting By Martinne Geller in New York; Additional reporting by Lauren Keiper in Boston and Brad Dorfman in Chicago; Editing by Lisa Von Ahn and Matthew Lewis.
At 9:49am EST, theflyonthewall.com via Yahoo! Finance reported that Deutsche Bank called the MJN stock weakness a buying opportunity.
Taking another angle, an article on Forbes.com claims that an MJN director (Robert Singer) purchased stock for $70.28 on 11-21-2011. So, in other words, insiders were buying for $70, then perhaps $6x is a good buy... Ya know, or the company's product line is going to fail. Either way... You can read that full article here: Get An Even Better Deal On MJN Than Director Singer Did
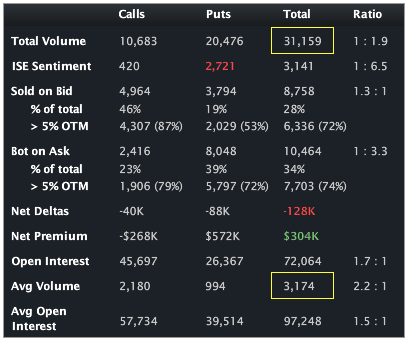
Today, MJN has traded over 31,000 contracts on total daily average option volume of just 3,174. Puts have traded on a nearly 2:1 ratio to calls with the action in the Jan 65 and 60 puts accounting for nearly half the days' volume. The Stats Tab and Day's biggest trades snapshots are included (below).

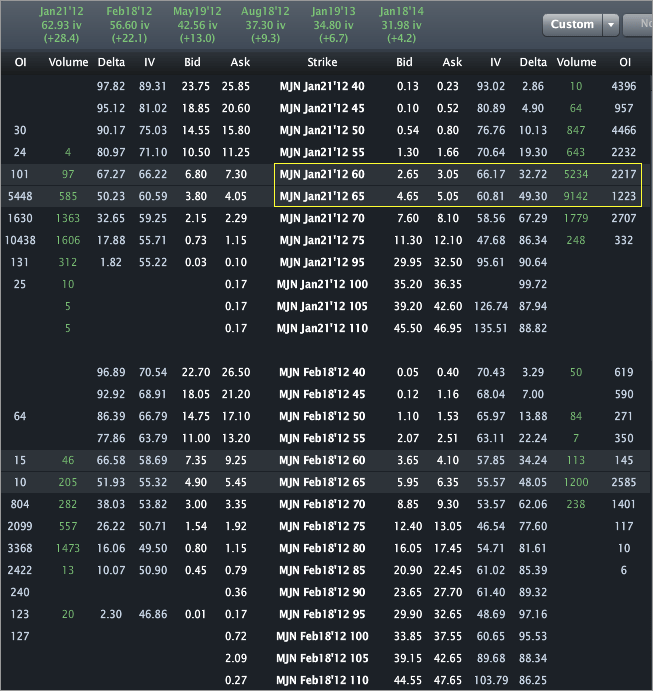
The Options Tab (below) illustrates that the puts are trading with higher volume than the OI on both lines. Those actually feel like purchases to me for the most part -- which is odd in that those are bets purchasing popping vol and a beaten down stock indicating bets to lower stock and / or higher vol levels.
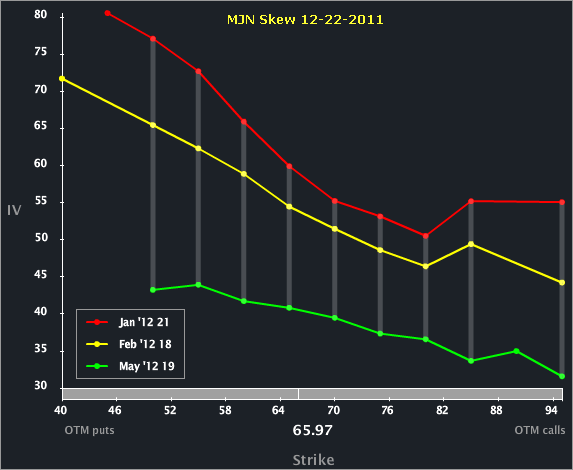
The Skew Tab snap (below) illustrates the vols by strike by month.
Through all of this craziness, the skew has actually maintained some order -- that is, the shape is normal with the downside puts showing higher vol than the ATM and the OTM calls. The front month is elevated to the back as is the the second to the third. Though it may be a bit early to look past this event, the next earnings release for MJN should be just after Jan expo -- so in Feb. Right now Feb options are priced to about six vol points lower than Jan.
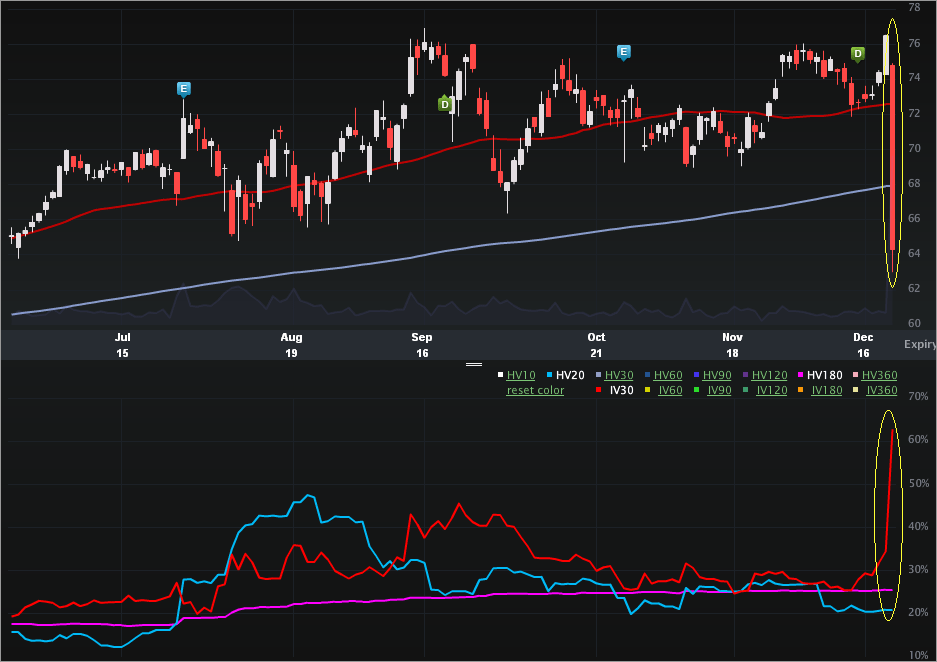
Finally, the Charts Tab (6 months) is below. The top portion is the stock price, the bottom is the vol (IV30™ - red vs HV20 - blue vs HV180 - pink).
We can see the drop today in the stock as well as the pop in IV30™ in the bottom portion. The 52 wk range in MJN stock price is [$54.26, $76.53] -- so the price today is not an annual low. The 52 wk range in IV30™ is [19.16%, 45.57%] -- so the implied is trading at an annual high... and then some. Keep in mind that the HV20 (and all HV measures) is recorded close-to-close, so that blue line will pop abruptly in tomorrow's chart.
This is trade analysis, not a recommendation.
- English (UK)
- English (India)
- English (Canada)
- English (Australia)
- English (South Africa)
- English (Philippines)
- English (Nigeria)
- Deutsch
- Español (España)
- Español (México)
- Français
- Italiano
- Nederlands
- Português (Portugal)
- Polski
- Português (Brasil)
- Русский
- Türkçe
- العربية
- Ελληνικά
- Svenska
- Suomi
- עברית
- 日本語
- 한국어
- 简体中文
- 繁體中文
- Bahasa Indonesia
- Bahasa Melayu
- ไทย
- Tiếng Việt
- हिंदी
Mead Johnson (MJN) - Stock Drops, 80% Spike in Vol Pushes New High on Product Recall from Wal-Mart
Published 12/23/2011, 03:02 AM
Updated 07/09/2023, 06:31 AM
Mead Johnson (MJN) - Stock Drops, 80% Spike in Vol Pushes New High on Product Recall from Wal-Mart
Latest comments
Loading next article…
Install Our App
Risk Disclosure: Trading in financial instruments and/or cryptocurrencies involves high risks including the risk of losing some, or all, of your investment amount, and may not be suitable for all investors. Prices of cryptocurrencies are extremely volatile and may be affected by external factors such as financial, regulatory or political events. Trading on margin increases the financial risks.
Before deciding to trade in financial instrument or cryptocurrencies you should be fully informed of the risks and costs associated with trading the financial markets, carefully consider your investment objectives, level of experience, and risk appetite, and seek professional advice where needed.
Fusion Media would like to remind you that the data contained in this website is not necessarily real-time nor accurate. The data and prices on the website are not necessarily provided by any market or exchange, but may be provided by market makers, and so prices may not be accurate and may differ from the actual price at any given market, meaning prices are indicative and not appropriate for trading purposes. Fusion Media and any provider of the data contained in this website will not accept liability for any loss or damage as a result of your trading, or your reliance on the information contained within this website.
It is prohibited to use, store, reproduce, display, modify, transmit or distribute the data contained in this website without the explicit prior written permission of Fusion Media and/or the data provider. All intellectual property rights are reserved by the providers and/or the exchange providing the data contained in this website.
Fusion Media may be compensated by the advertisers that appear on the website, based on your interaction with the advertisements or advertisers.
© 2007-2024 - Fusion Media Limited. All Rights Reserved.
