
McKesson Corporation’s (NYSE:MCK) third-quarter fiscal 2019 earnings of $3.40 per share outshined the Zacks Consensus Estimate by 6.9%. However, adjusted earnings inched down by a penny on a year-over-year basis.
Revenues came in at $56.21 billion, which outpaced the Zacks Consensus Estimate by 1.7% and improved 4.8% year over year.
Following the announcement, share prices shot up courtesy of better earnings per share guidance provided by the company. Notably, for fiscal 2019, McKesson expects adjusted earnings per share in the range of $13.45-$13.65 compared with the previous guidance of $13.20-$13.80. The midpoint of the latest guidance range of $13.55 beats the Zacks Consensus Estimate of $13.41.
In a year’s time, shares of the Zacks Rank #3 (Hold) stock has lost 25.7% compared with the industry’s 12.3% and the S&P 500 index’s 5% declines.
McKesson Corporation Price, Consensus and EPS Surprise
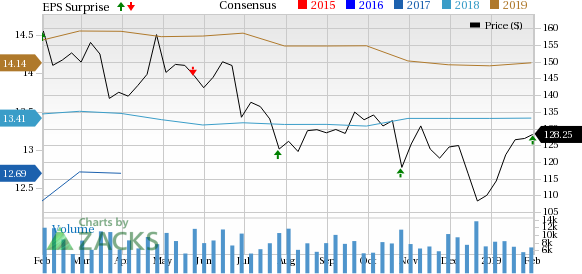
McKesson Corporation Price, Consensus and EPS Surprise | McKesson Corporation Quote
Segmental Analysis
Revenues at the U.S. Pharmaceutical and Specialty Solutions segment totaled $44.28 billion, up 5.5% year over year. Per management, the upside was primarily driven by market growth and acquisitions.
At the European Pharmaceutical Solutions segment, revenues amounted to $6.91 billion, down 1.1% year over year. However, the metric shot up 2% at constant currency (cc). Revenue growth was offset by reduction in owned retail pharmacies and a challenging operating environment in the United Kingdom. The segment was also impacted by unfavorable currency movements.
Revenues at the Medical-Surgical Solutions segment amounted to $2.01 billion, up 18.8% year over year.
Revenues at the Other segment were $3.01 billion in the fiscal third quarter, up 1.3% year over year and 5% at cc.
Margins
Gross profit in the reported quarter was $2.97 billion, up 9.4% on a year-over-year basis. Meanwhile, gross margin was 5.3% of net revenues, up 20 basis points (bps).
Operating income in the quarter was $683 million, down 18.1% year over year. Operating margin was 1.2%, down 40 bps.
The U.S. Pharmaceutical and Specialty Solutions segment reported adjusted operating profit of $593 million. Adjusted operating margin was 1.3% at the segment.
Adjusted operating profit at the European Pharmaceutical Solutions segment summed $71 million, while adjusted operating margin was 1 %.
The Medical-Surgical segment had adjusted operating profit of $170 million. Adjusted operating margin was 8.5% at the segment.
Adjusted operating profit was $226 million at the Other segment.
Summing Up
McKesson exited the fiscal third quarter on a solid note, with both earnings and revenues beating the consensus mark. Strong third-quarter show by core U.S. Pharmaceutical and Specialty Solutions segment buoys optimism. Also, management is optimistic about the 10-year partnership signed with Rite Aid. McKesson continues to expect incremental synergies from the MSD acquisition. McKesson Canada too saw a healthy third quarter.
These apart, the company launched an Opioid Foundation with a view to address the current U.S. opioid crisis.
On the flip side, McKesson’s European Pharmaceutical Solutions witnessed a soft third quarter due to challenges in the United Kingdom. Unfavorable currency movements too partially marred the segment’s performance. Contraction in operating income is also discouraging. Price fluctuation of generic pharmaceuticals and stiff competition in the MedTech space are added concerns.
Earnings of Other MedTech Majors at a Glance
Some better-ranked MedTech stocks that posted solid results in their respective quarters are Varian Medical Systems (NYSE:VAR) , AngioDynamics (NASDAQ:ANGO) and CONMED Corporation (NASDAQ:CNMD) .
Varian reported fiscal first-quarter adjusted EPS of $1.06, in line with the Zacks Consensus Estimate. Revenues of $741 million outpaced the consensus mark of $717.9 million. The stock has a Zacks Rank #2 (Buy).
AngioDynamics’ fiscal second-quarter adjusted EPS of 22 cents exceeded the Zacks Consensus Estimate by a penny. Revenues totaled $91.5 million, which surpassed the consensus estimate by 2.9%. The stock sports a Zacks Rank #1 (Strong Buy). You can see the complete list of today’s Zacks #1 Rank stocks here.
CONMED delivered fourth-quarter adjusted EPS of 73 cents, in line with the Zacks Consensus Estimate. Revenues of $242.4 million outshined the Zacks Consensus Estimate of $229.2 million. The stock carries a Zacks Rank of 2.
More Stock News: This Is Bigger than the iPhone!
It could become the mother of all technological revolutions. Apple (NASDAQ:AAPL) sold a mere 1 billion iPhones in 10 years but a new breakthrough is expected to generate more than 27 billion devices in just 3 years, creating a $1.7 trillion market.
Zacks has just released a Special Report that spotlights this fast-emerging phenomenon and 6 tickers for taking advantage of it. If you don't buy now, you may kick yourself in 2020.
Click here for the 6 trades >>
AngioDynamics, Inc. (ANGO): Free Stock Analysis Report
Varian Medical Systems, Inc. (VAR): Free Stock Analysis Report
CONMED Corporation (CNMD): Free Stock Analysis Report
McKesson Corporation (MCK): Get Free Report
Original post
Zacks Investment Research