This article is going to look at Fortune 500 company McKesson Corp (MCK) through the lens of FAST Graphs™, fundamentals analyzer software tool, which shows us 18 leading analysts reporting to Capital IQ forecast McKesson Corp’s long-term earnings growth at 13%. The prudent growth and dividend investor may want to do their own due diligence into this company further for a possible addition to their portfolio.
“McKesson Corporation, currently ranked 14th on the FORTUNE 500, is a healthcare services and information technology company dedicated to making the business of healthcare run better. We partner with payers, hospitals, physician offices, pharmacies, pharmaceutical companies and others across the spectrum of care to build healthier organizations that deliver better care to patients in every setting. McKesson helps its customers improve their financial, operational, and clinical performance with solutions that include pharmaceutical and medical-surgical supply management, healthcare information technology, and business and clinical services.”
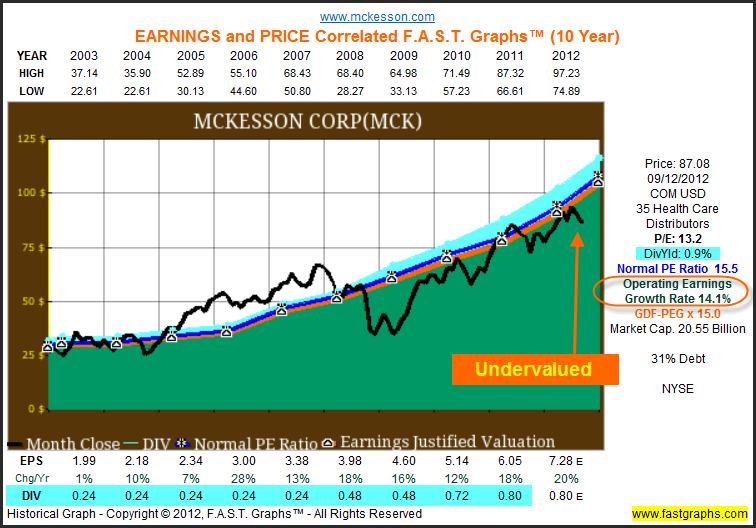
Earnings Determine Market Price: The following earnings and price correlated FAST Graphs™ clearly illustrates the importance of earnings. The Earnings Growth Rate Line or True Worth™ Line (orange line with white triangles) is correlated with the historical stock price line. On graph after graph the lines will move in tandem. If the stock price strays away from the earnings line (over or under), inevitably it will come back to earnings.
Earnings & Price Correlated Fundamentals-at-a-Glance
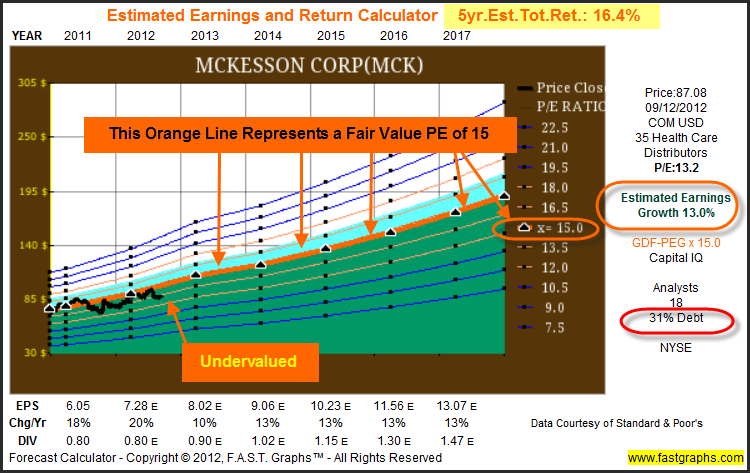
A quick glance at the historical earnings and price correlated FAST Graphs™ on McKesson Corp shows a picture of undervaluation based upon the historical earnings growth rate of 14.1% (orange circle) and a current PE of 13.2. Analysts are forecasting the earnings growth to continue at about 13%, and when you look at the forecasting graph below, the stock appears undervalued, (it’s inside of the value corridor of the five orange lines - based on future growth).
McKesson Corp: Historical Earnings, Price, Dividends and Normal PE Since 2003
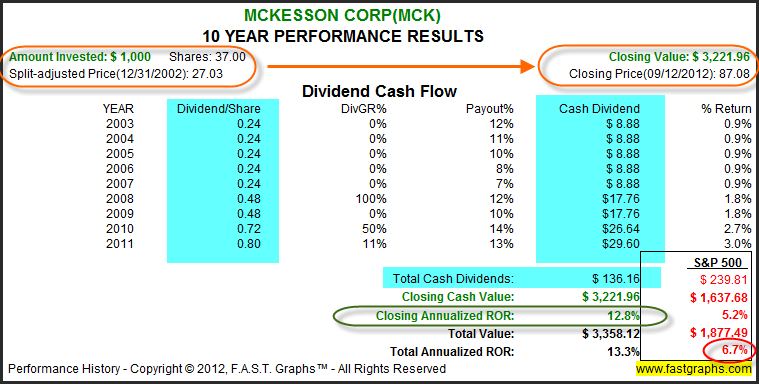
Performance Table McKesson Corp
The associated performance results with the earnings and price correlated graph, validates the principles regarding the two components of total return; capital appreciation and dividend income. Dividends are included in the total return calculation and are assumed paid, but not reinvested.
When presented separately like this, the additional rate of return a dividend paying stock produces for shareholders becomes undeniably evident. In addition to the 12.8% capital appreciation (green circle), long-term shareholders of McKesson Corp, assuming an initial investment of $1,000, would have received an additional $136.16 in dividends (blue highlighting) that increased their total return from 12.8% to 13.3% per annum versus 6.7% (red circle) in the S&P 500.
The following graph plots the historical PE ratio (the dark blue line) in conjunction with 10-year Treasury note interest. Notice that the current price earnings ratio on this quality company is as normal as it has been since 2003.
A further indication of valuation can be seen by examining a company’s current price to sales ratio relative to its historical price to sales ratio. The current price to sales ratio for McKesson Corp is .17 which is historically normal. 
Looking to the Future
Extensive research has provided a preponderance of conclusive evidence that future long-term returns are a function of two critical determinants:
1. The rate of change (growth rate) of the company’s earnings
2. The price or valuation you pay to buy those earnings
Forecasting future earnings growth, bought at sound valuations, is the key to safe, sound, and profitable performance.
The Estimated Earnings and Return Calculator Tool is a simple yet powerful resource that empowers the user to calculate and run various investing scenarios that generate precise rate of return potentialities. Thinking the investment through to its logical conclusion is an important component towards making sound and prudent commonsense investing decisions.
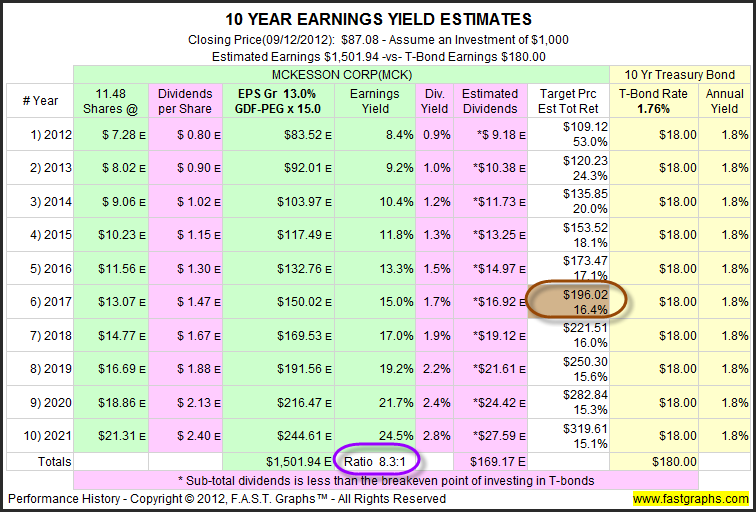
The consensus of 18 leading analysts reporting to Capital IQ forecast McKesson Corp’s long-term earnings growth at 13% (orange circle). McKesson Corp has medium long-term debt at 31% of capital (red circle). McKesson Corp is currently trading at a P/E of 13.2, which is inside the value corridor (defined by the five orange lines) of a maximum P/E of 18. If the earnings materialize as forecast, McKesson Corp’s True Worth™ valuation would be $196.02 at the end of 2017 (brown circle on EYE Chart), which would be a 16.4% annual rate of return from the current price (yellow highlighting).
Earnings Yield Estimates
Discounted Future Cash Flows: All companies derive their value from the future cash flows (earnings) they are capable of generating for their stakeholders over time. Therefore, because Earnings Determine Market Price in the long run, we expect the future earnings of a company to justify the price we pay.
Since all investments potentially compete with all other investments, it is useful to compare investing in any prospective company to that of a comparable investment in low risk Treasury bonds. Comparing an investment in McKesson Corp to an equal investment in 10 year Treasury bonds, illustrates that McKesson Corp’s expected earnings would be 8.3 (purple circle) times that of the 10 Year T-Bond Interest. (See EYE chart below). This is the essence of the importance of proper valuation as a critical investing component.
Summary & Conclusions
This report presented essential “fundamentals at a glance” illustrating the past and present valuation based on earnings achievements as reported. Future forecasts for earnings growth are based on the consensus of leading analysts. Although, with just a quick glance you can know a lot about the company, it’s imperative that the reader conducts their own due diligence in order to validate whether the consensus estimates seem reasonable or not.
Disclosure: No position at the time of writing.
Disclaimer: The opinions in this document are for informational and educational purposes only and should not be construed as a recommendation to buy or sell the stocks mentioned or to solicit transactions or clients. Past performance of the companies discussed may not continue and the companies may not achieve the earnings growth as predicted. The information in this document is believed to be accurate, but under no circumstances should a person act upon the information contained within. We do not recommend that anyone act upon any investment information without first consulting an investment advisor as to the suitability of such investments for his specific situation. A comprehensive due diligence effort is recommended.
- English (UK)
- English (India)
- English (Canada)
- English (Australia)
- English (South Africa)
- English (Philippines)
- English (Nigeria)
- Deutsch
- Español (España)
- Español (México)
- Français
- Italiano
- Nederlands
- Português (Portugal)
- Polski
- Português (Brasil)
- Русский
- Türkçe
- العربية
- Ελληνικά
- Svenska
- Suomi
- עברית
- 日本語
- 한국어
- 简体中文
- 繁體中文
- Bahasa Indonesia
- Bahasa Melayu
- ไทย
- Tiếng Việt
- हिंदी
McKesson Corp: Stock Research Analysis
Published 09/14/2012, 07:43 AM
Updated 07/09/2023, 06:32 AM
McKesson Corp: Stock Research Analysis
3rd party Ad. Not an offer or recommendation by Investing.com. See disclosure here or
remove ads
.
Latest comments
Install Our App
Risk Disclosure: Trading in financial instruments and/or cryptocurrencies involves high risks including the risk of losing some, or all, of your investment amount, and may not be suitable for all investors. Prices of cryptocurrencies are extremely volatile and may be affected by external factors such as financial, regulatory or political events. Trading on margin increases the financial risks.
Before deciding to trade in financial instrument or cryptocurrencies you should be fully informed of the risks and costs associated with trading the financial markets, carefully consider your investment objectives, level of experience, and risk appetite, and seek professional advice where needed.
Fusion Media would like to remind you that the data contained in this website is not necessarily real-time nor accurate. The data and prices on the website are not necessarily provided by any market or exchange, but may be provided by market makers, and so prices may not be accurate and may differ from the actual price at any given market, meaning prices are indicative and not appropriate for trading purposes. Fusion Media and any provider of the data contained in this website will not accept liability for any loss or damage as a result of your trading, or your reliance on the information contained within this website.
It is prohibited to use, store, reproduce, display, modify, transmit or distribute the data contained in this website without the explicit prior written permission of Fusion Media and/or the data provider. All intellectual property rights are reserved by the providers and/or the exchange providing the data contained in this website.
Fusion Media may be compensated by the advertisers that appear on the website, based on your interaction with the advertisements or advertisers.
© 2007-2024 - Fusion Media Limited. All Rights Reserved.
