Nobody can predict the future like investors (although the weather guys are pretty good). But it's the ones with real money on the line who are most likely to do their homework. That's why bond yields can give us so much insight into what may be coming for the economy.
Usually, investors want to get a higher rate for locking their money in for a longer period of time. However, when the market rates for short-term bonds grow in relation to the long term, it's a good indication that investors are expecting economic uncertainty or even a recession in the near term.
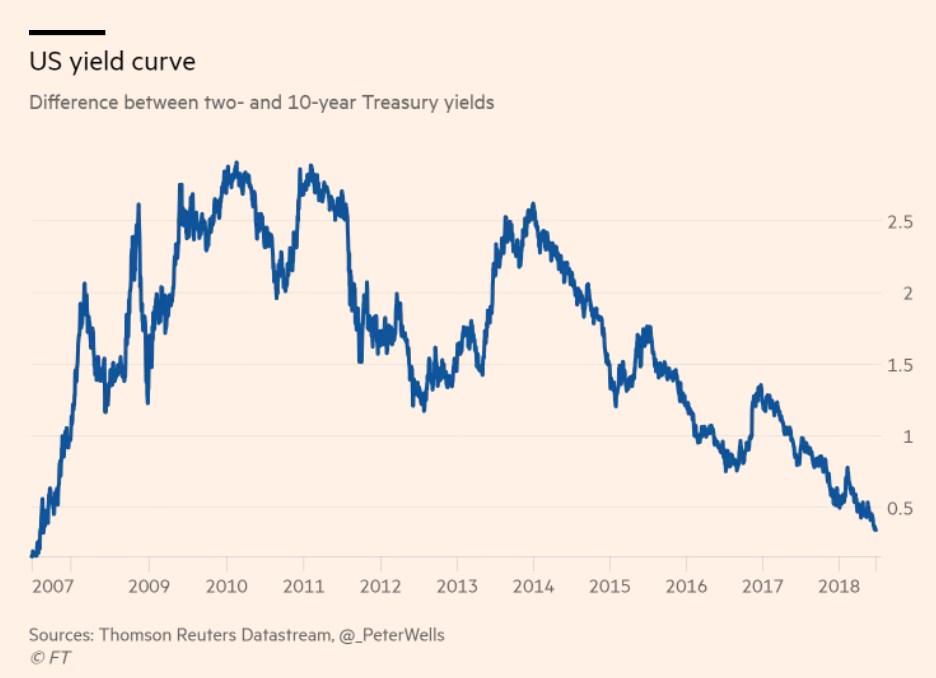
At the moment, the difference between the 2-Year and 10-Year bonds is the lowest its been since 2007.
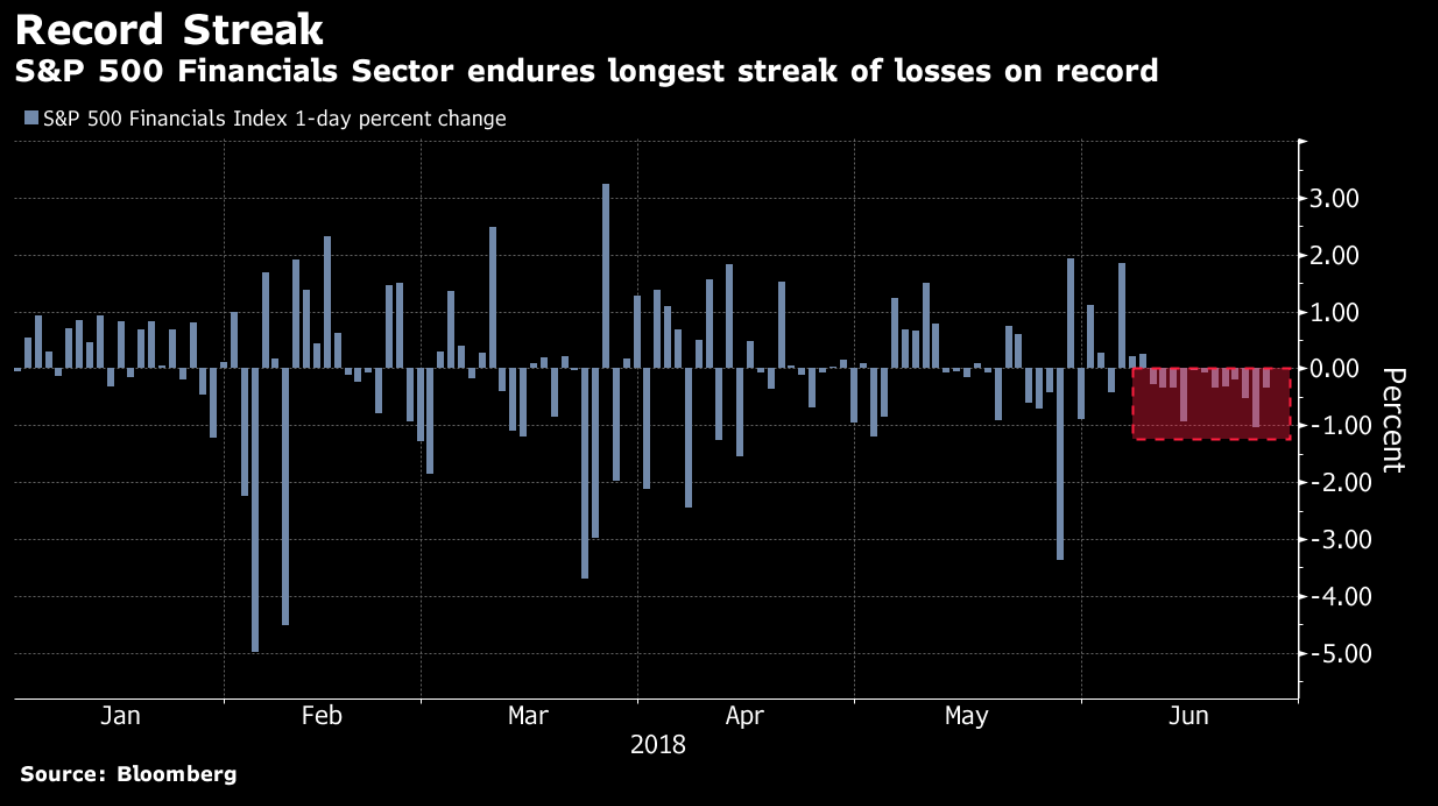
This is particularly troubling for the financial sector which is on its worst losing streak ever.
Even the @TheBigBanks copyfund strategy on eToro is down 8.5% so far this year.
Today's Highlights
Renminbi Yields to USD
???Crude???
Crypto Under Pressure
Please note: All data, figures & graphs are valid as of June 27th. All trading carries risk. Please risk only capital you can afford to lose.
Traditional Markets
Trade fears continue to grip the markets. Stocks are yielding and the US dollar is gaining.
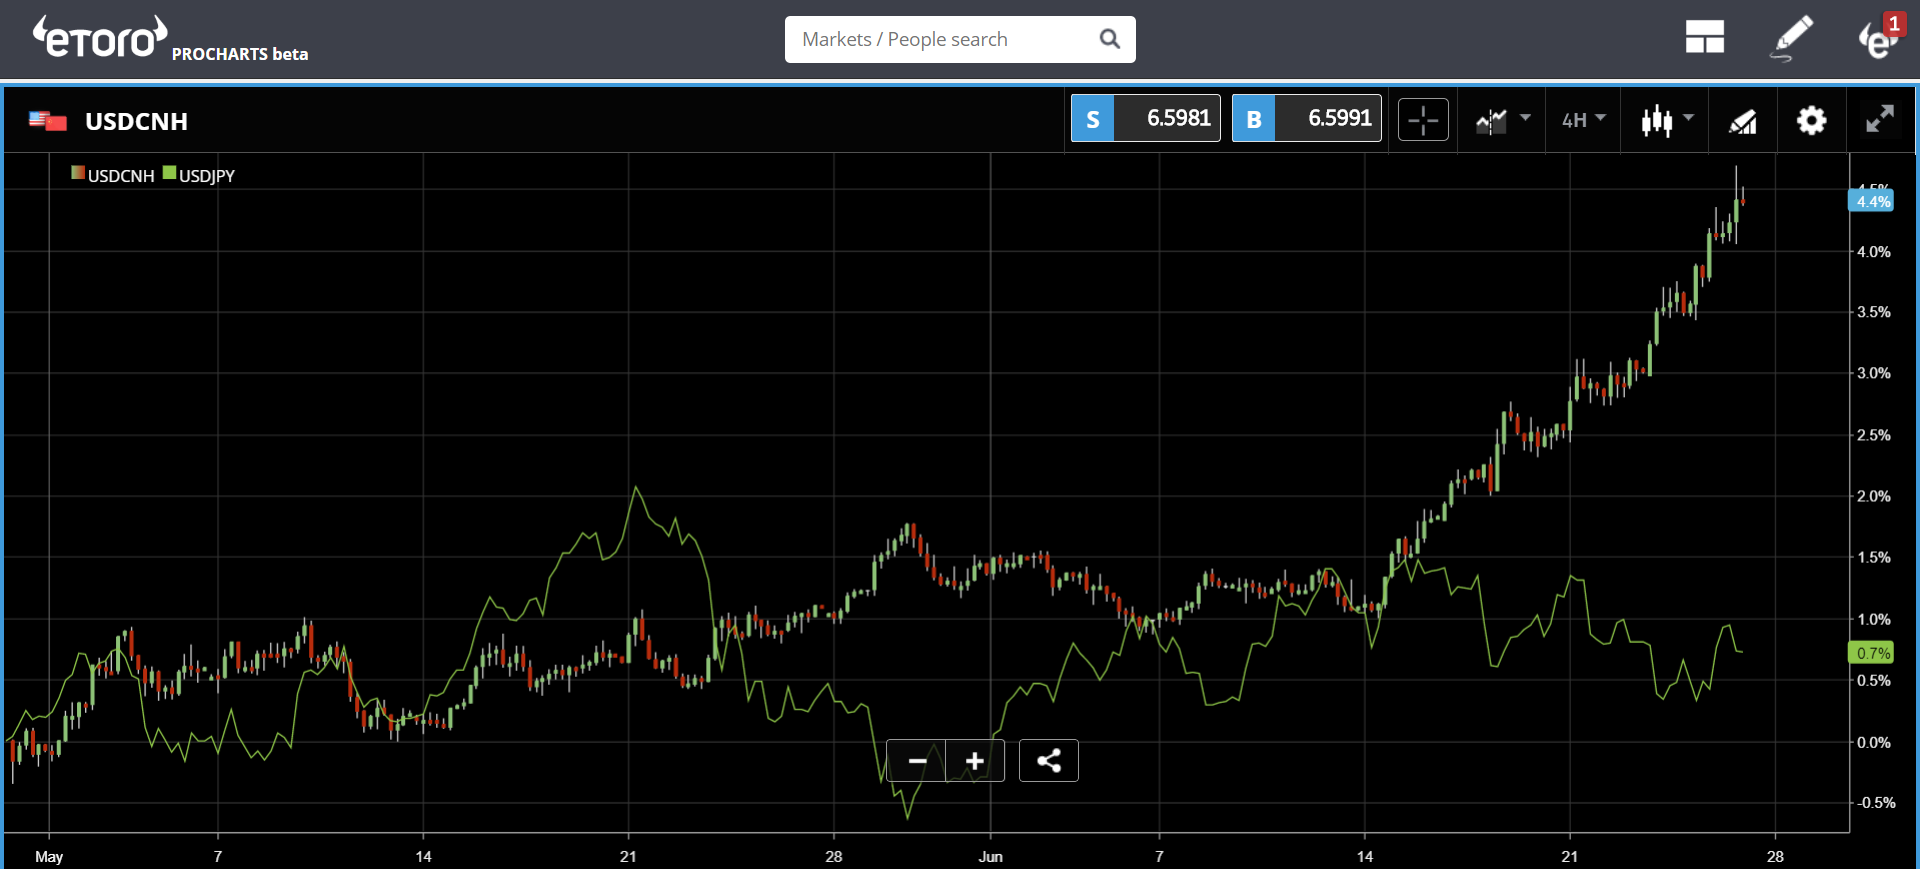
One of the biggest movements we've been tracking is that of the USD against the Chinese Renminbi. This of course goes right to the heart of the drama that is playing out on the geopolitical stage and looking at the chart, we can see the clear winner.
The Japanese Yen on the other hand, is acting as a safe haven for Asian investors and is not only holding ground against the Buck but even making some mild gains.
In this chart, we can see the dollar gaining ground against the Chinese Renminbi (USD/CNH). For impact, I've overlaid the USD/JPY (green line) on top so we can see the difference.
Strange Oil
Saudi Arabia and Russia are talking about increasing oil production. So why is the price going up?
Some are saying that this is due to the hard deadline imposed by Trump's administration for buying Iranian Oil, which will come into effect in September.
Others are saying that the rise is due to declining stockpiles in the United States. The weekly crude oil inventories will be announced in the USA today at 14:30 GMT, and indeed analysts are forecasting that the data will show a decline of 2.4 million barrels.
However, this is a much smaller number than we saw last week (decline of 5.9M barrels).
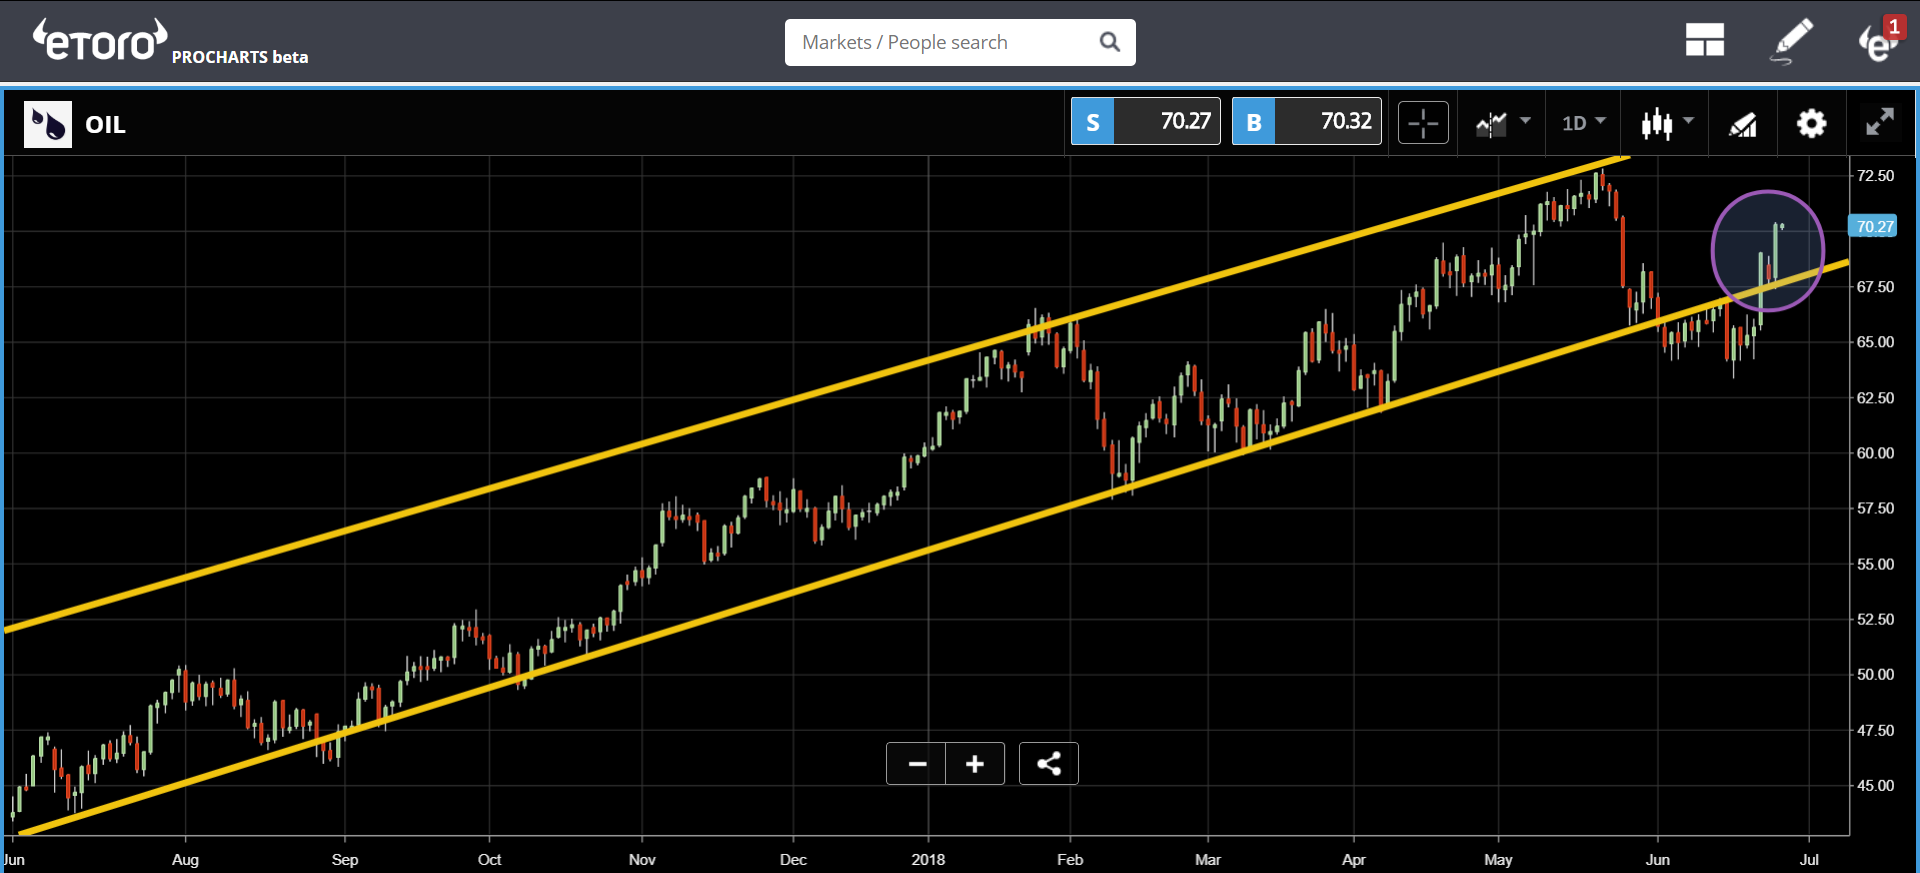
Looking at the chart, it seems that yesterday's movement has brought the price right back into its familiar range, which is the massive upward channel of the last 12 months.
Craful Crypto
Not much is happening in the news on the crypto front but it does seem that prices are declining lightly this morning.
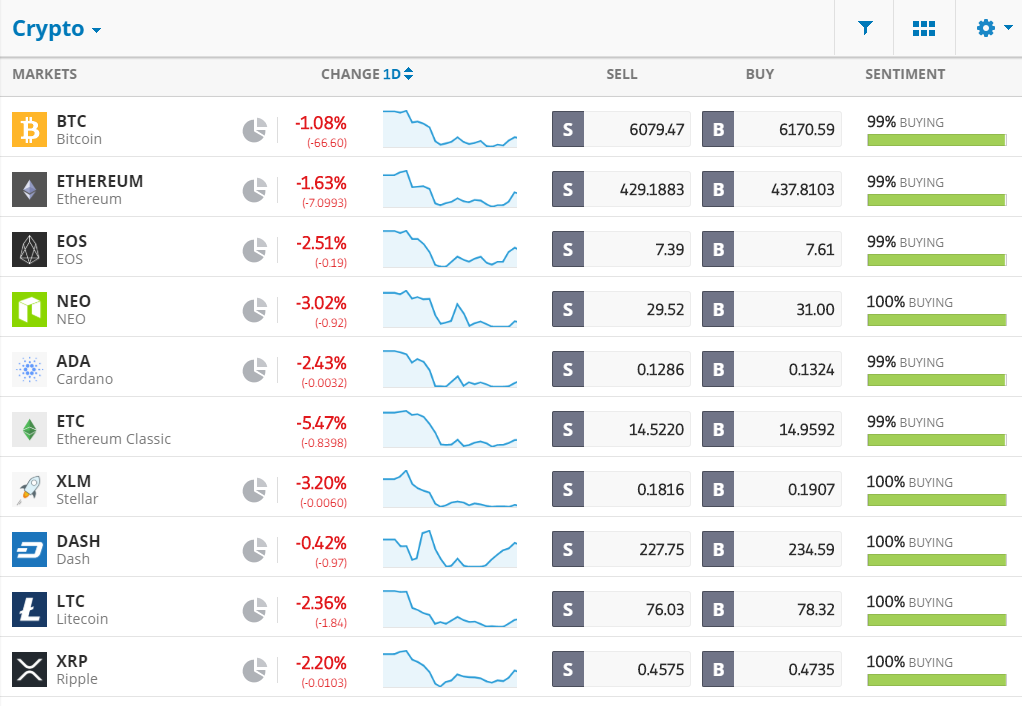
As far as Bitcoin is concerned, we're getting very close to some critical support levels. After seeing the lowest point this year on Sunday, the price has bounced back a bit, but we're not quite out of the woods yet.
In the short term chart, we can see that there has been a declining channel ever since we failed to break above the $10,000 mark in early May.
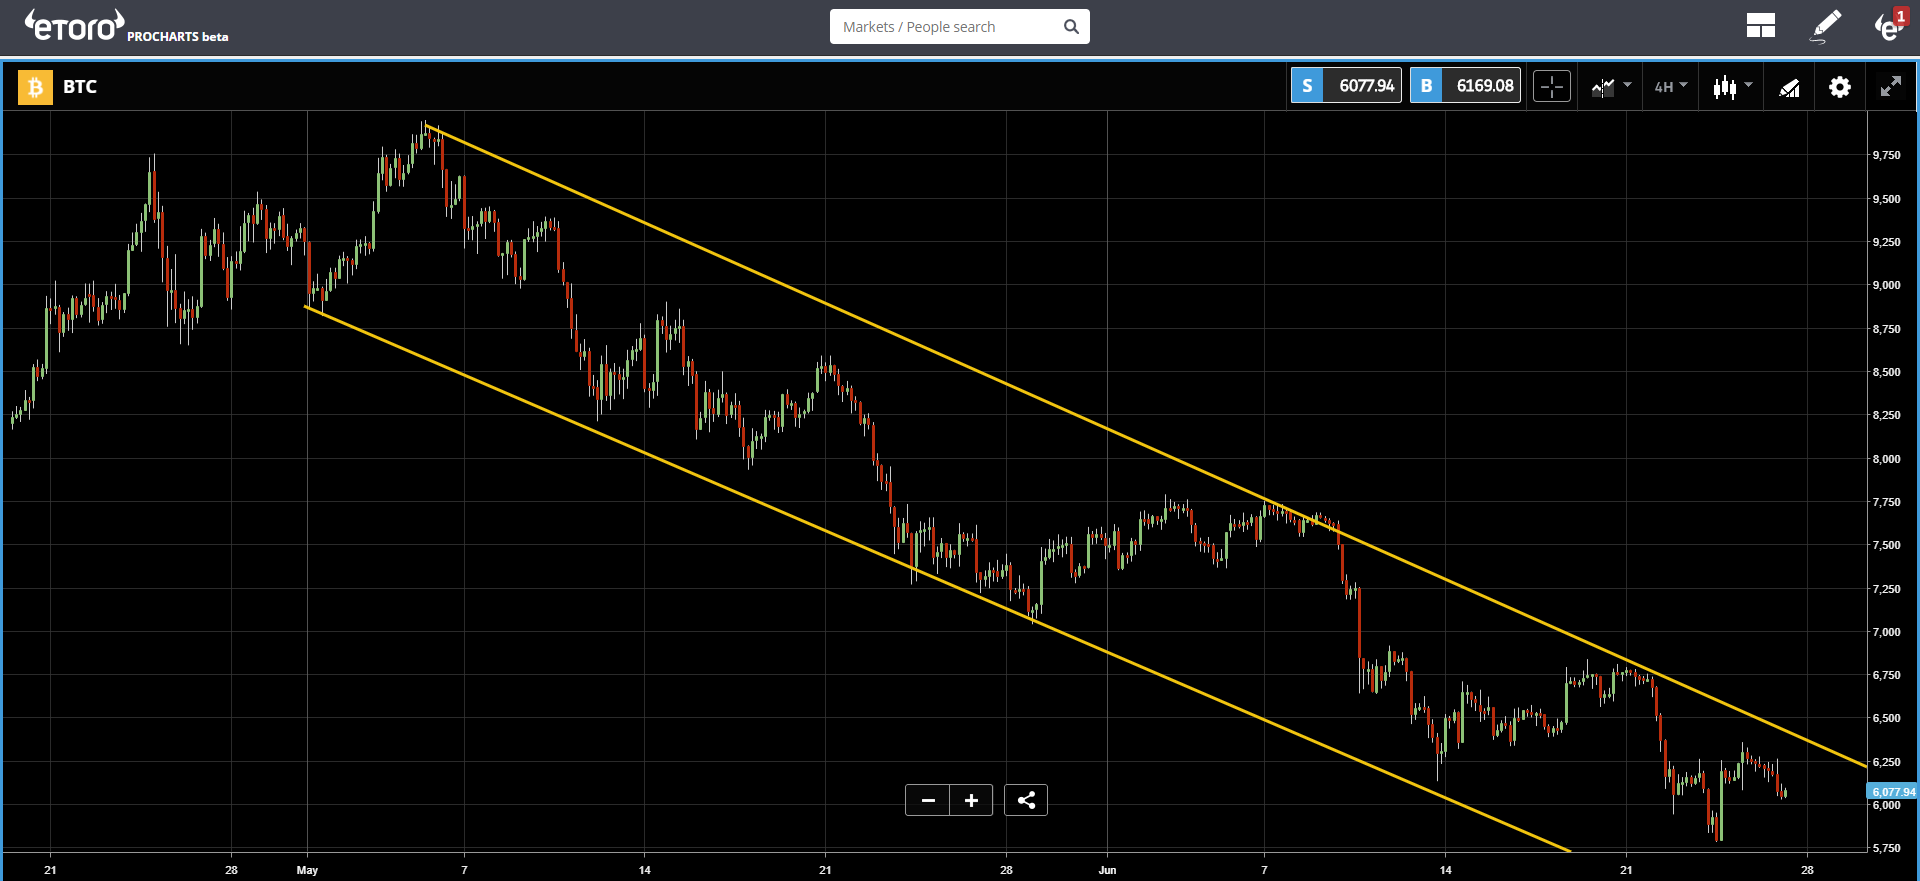
While many will see this as a chance to buy the dip, it is possible that it could go even lower.
As always, please make sure to maintain a diversified portfolio in order to reduce your risk.
Let's have an awesome day!
eToro, Senior Market Analyst
Disclosure: This content is for information and educational purposes only and should not be considered investment advice or an investment recommendation. Past performance is not an indication of future results. All trading carries risk. Only risk capital you're prepared to lose.
