The U.S. dollar was seen trading mixed by Friday's close as the currency pair failed to hold on to the gains across some of its peers. The U.S. dollar fell sharply against the Japanese yen, while against the euro and the British pound, the greenback was trading rather flat.
Economic data on Friday saw the inflation report from Canada. Coming in line with estimates, monthly inflation rate turned flat as expected following a 0.1% decline previously. The UoM consumer sentiment showed an increase to 97.6, beating estimates of 94.0 while inflation expectations from the UoM remained steady at 2.6%.
Looking ahead, the economic calendar today is light with no major events scheduled. Second tier data includes Canada's wholesale sales. With the Jackson Hole event due to start this Thursday, the markets are likely to take a breather ahead of the key event which will see speeches from ECB's Draghi.
EUR/USD Intra-Day Analysis

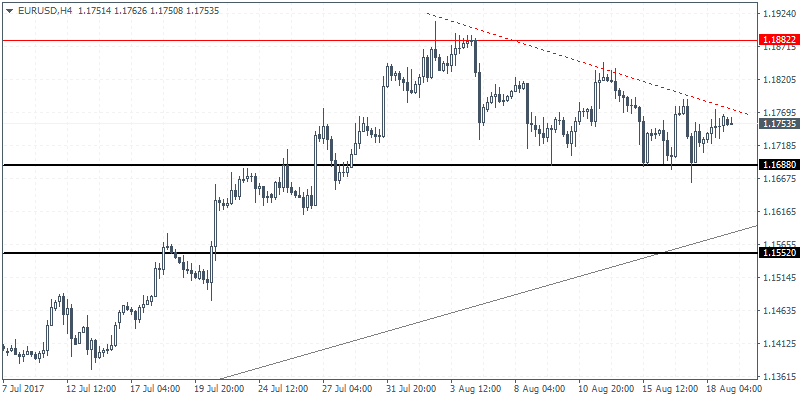
EUR/USD (1.1753): The EUR/USD has managed to hold up above the 1.1688 support level multiple times. However, any subsequent bounce off this support has kept EUR/USD posting lower highs. This consolidation has led to a descending triangle pattern that is currently forming. With the support now critical, a downside breakout could send the euro sliding towards the support level at 1.1552. In the near term, we expect to see the common currency continue to trade sideways. There is also a risk of an upside breakout in prices. This could come on a price breakout from the falling trend line. To the upside, the euro will need to struggle to break past the previous resistance at 1.18820.
GBP/USD Intra-Day Analysis

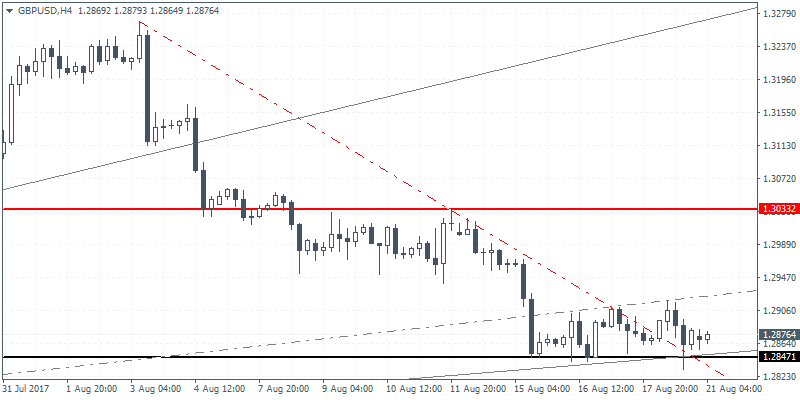
GBP/USD (1.2876): The British pound was seen trading flat near the support level at 1.2847 for the past three days. This price level was previously tested in early July. The rebound off this level is therefore quite likely as GBP/USD could be seen reversing the losses from the past few weeks. Price action in GBP/USD suggests that there is a strong possibility for a rebound back to 1.3000 - 1.3033 level of resistance in the near term. This could also form the potential head and shoulders pattern as a result. A reversal needs to be confirmed at 1.3000 - 1.3033 level however. This would then set the tone for a bearish decline in GBP/USD that could be seen testing the lower support at 1.2628 support, marking the measured move from the head and shoulders pattern. A break out above the previous highs at 1.3200 could however invalidate this downside bias.
USD/JPY Intra-Day Analysis

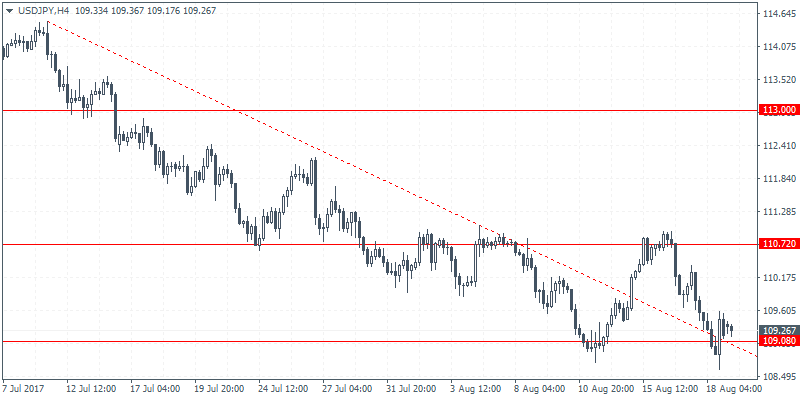
USD/JPY (109.26): The Japanese yen strengthened strongly against the U.S. dollar last week as price fell back to the support level at 109.15. This was the same support level that price managed to post a reversal earlier in the week. On the 4-hour chart, we can see that price action has managed to recover off the lows and closed above the support level of 109.08. A rebound off this support level could keep USD/JPY biased to the upside. Resistance level at 110.72 will be in focus immediately, but above this level, USD/JPY could pose a risk of an upside rally towards the next main resistance level at 113.00.
