“There are decades where nothing happens, and there are weeks where decades happen.”
- Vladimir Lenin
Poetically, today’s market volatility (a proverbial day where a decade is happening) is heavily a result of actions from Russia, Lenin’s motherland. After Russia rejected an oil production cut plan from OPEC late last week, Saudi Arabia launched a full-on “price war,” cutting prices for a barrel of oil by $6-$8 over the weekend. With production ramping up at the exact moment that demand is drying up due to coronavirus fears, the oil market has gone into a tailspin, collapsing by over 20% so far today to trade down nearly 50% on the year to date.
Combined with this weekend’s dour headlines around the spread of coronavirus, the massive move in oil has thrown global markets into sheer panic:
- Major European indices are trading down 5-7%, with US index futures flirting with limit down at -5%.
- Global bond yields are collapsing in a huge “flight to safety” bid. The entire US Treasury curve is now trading below 1%.
- Oil is seeing its biggest one-day drop since the start of the Gulf War in 1991
- Even crypto assets are in freefall, with market benchmark Bitcoin shedding $1200 over the weekend.
- Outside of bonds, gold is the only major asset bucking the selling trend by gaining roughly 0.5% as of writing.
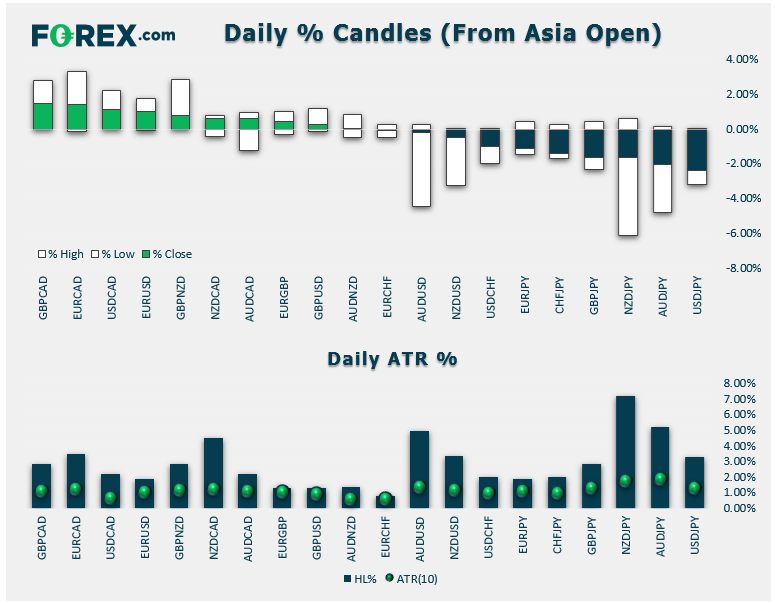
While those moves are certainly headline-grabbing, the normally stoic FX market has seen its fair share of volatility as well. As of writing, the most dramatic moves are in the “safe haven” Japanese yen, which is tacking on roughly 3% against the US dollar and in the oil-correlated Canadian dollar, which is falling by more than 1.5% against the greenback. As the chart below shows, almost every major currency pair has eclipsed its average daily move already, and those dramatic moves could easily extend heading into North American trade:
For the rest of the day, global markets will take their cue from Wall Street. There’s no doubt it will be an ugly day for investors regardless, but if US traders are able to stem the bleeding or even prompt an intraday rally, bargain hunters could step in and prompt a bounce in risk appetite. On the other hand, if US traders extend the panic from the Asian and European sessions, we could see a true collapse in global markets as investors acknowledge that the situation will likely get worse before it gets better.
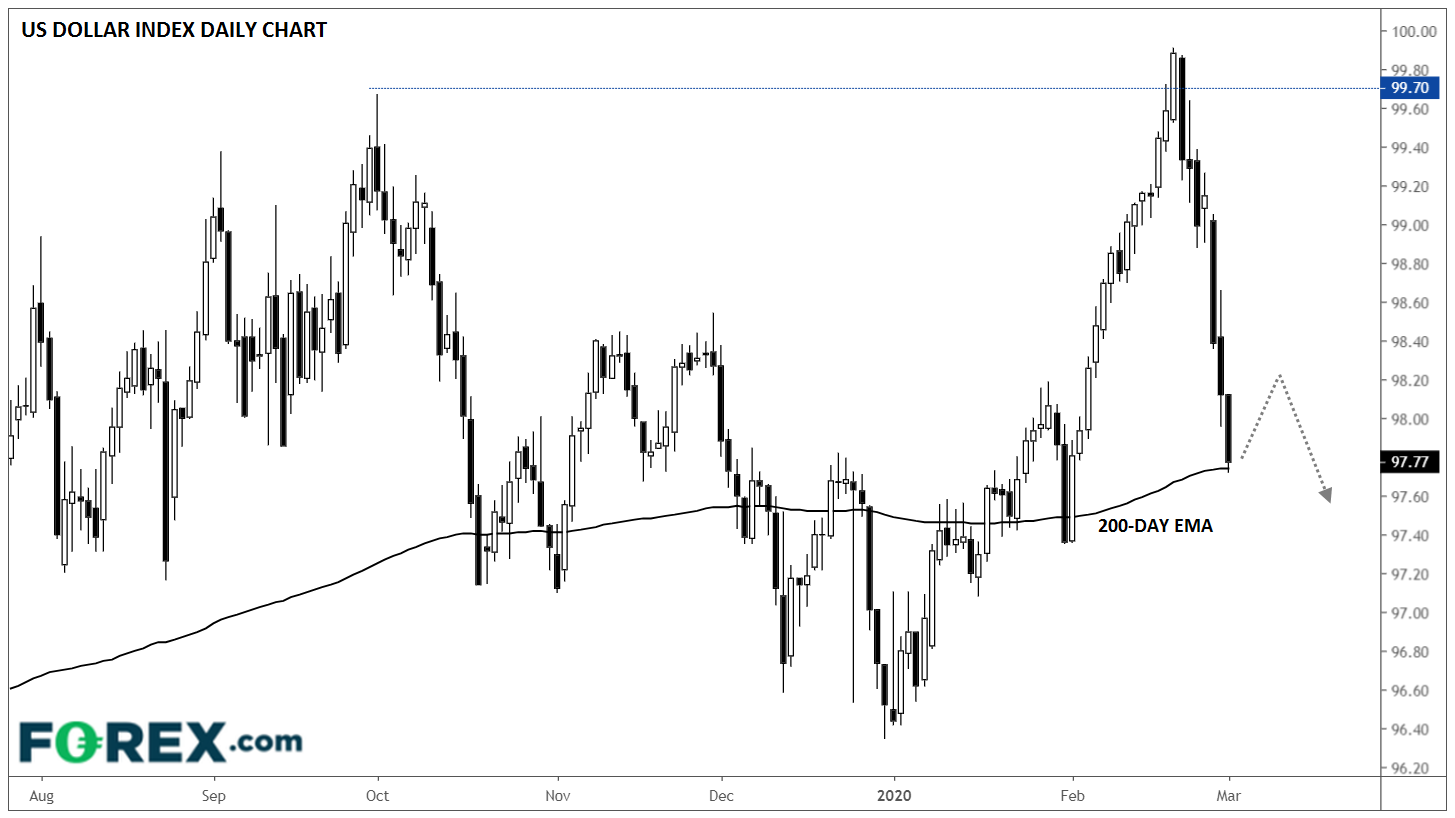
Regardless, the US dollar index has definitively broken the key support level we highlighted on Friday. As of writing, the index is trading down nearly 1%, the biggest one-day drop since August and the second-largest drop since early 2018. With some analysts estimating that coronavirus cases in the US will (at least) double this week, the fundamentals of the economy and markets are likely to get worse before they get better. Technically speaking, the US dollar index is probing minor support from October 2018 and January 2019 near 95.00, but a definitive break below this floor could expose the lows from Q3 2018 near 93.75 next.
- English (UK)
- English (India)
- English (Canada)
- English (Australia)
- English (South Africa)
- English (Philippines)
- English (Nigeria)
- Deutsch
- Español (España)
- Español (México)
- Français
- Italiano
- Nederlands
- Português (Portugal)
- Polski
- Português (Brasil)
- Русский
- Türkçe
- العربية
- Ελληνικά
- Svenska
- Suomi
- עברית
- 日本語
- 한국어
- 简体中文
- 繁體中文
- Bahasa Indonesia
- Bahasa Melayu
- ไทย
- Tiếng Việt
- हिंदी
Markets In Turmoil: The Dollar’s Drop In Context
Published 03/09/2020, 08:10 AM
Updated 07/09/2023, 06:31 AM
Markets In Turmoil: The Dollar’s Drop In Context
3rd party Ad. Not an offer or recommendation by Investing.com. See disclosure here or
remove ads
.
Latest comments
Install Our App
Risk Disclosure: Trading in financial instruments and/or cryptocurrencies involves high risks including the risk of losing some, or all, of your investment amount, and may not be suitable for all investors. Prices of cryptocurrencies are extremely volatile and may be affected by external factors such as financial, regulatory or political events. Trading on margin increases the financial risks.
Before deciding to trade in financial instrument or cryptocurrencies you should be fully informed of the risks and costs associated with trading the financial markets, carefully consider your investment objectives, level of experience, and risk appetite, and seek professional advice where needed.
Fusion Media would like to remind you that the data contained in this website is not necessarily real-time nor accurate. The data and prices on the website are not necessarily provided by any market or exchange, but may be provided by market makers, and so prices may not be accurate and may differ from the actual price at any given market, meaning prices are indicative and not appropriate for trading purposes. Fusion Media and any provider of the data contained in this website will not accept liability for any loss or damage as a result of your trading, or your reliance on the information contained within this website.
It is prohibited to use, store, reproduce, display, modify, transmit or distribute the data contained in this website without the explicit prior written permission of Fusion Media and/or the data provider. All intellectual property rights are reserved by the providers and/or the exchange providing the data contained in this website.
Fusion Media may be compensated by the advertisers that appear on the website, based on your interaction with the advertisements or advertisers.
© 2007-2024 - Fusion Media Limited. All Rights Reserved.


