
European shares rebounded strongly yesterday, perhaps as the BoE said that they do not to undermine the economic recovery by premature tightening, disappointing those expecting signals that something like that could be announced at the next gathering. Sentiment stayed supported during the US session as well, aided by a bipartisan Senate infrastructure deal, which may help to extend the recovery in the world’s largest economy. As for today, attention is likely to fall on the core PCE index for May, which is the Fed’s favorite inflation metric.
Equiites Rebound On Dovish BOE And US Infrastructure Deal
The US dollar continued to slide against the majority of the other major currencies on Thursday and during the Asian session Friday. It lost the most ground versus NZD, AUD and CHF in that order, while it eked out gains only versus GBP and CAD.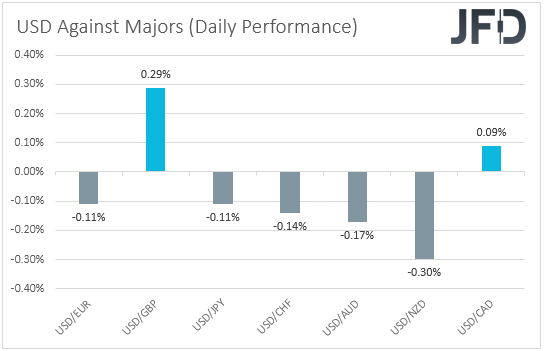
The weakening of the US dollar and the strengthening of the risk-linked Aussie and Kiwi suggest that markets traded in a risk-on fashion yesterday and today in Asia. However, the strengthening of the Swiss franc and the weakening of the Loonie point otherwise. Thus, in order to get a clearer picture with regards to the broader market sentiment, we prefer to turn our gaze to the equity world. There, we see that major EU and US indices were a sea of green, with the S&P 500 and NASDAQ hitting fresh record highs. The increased risk appetite rolled over into the Asian session today as well.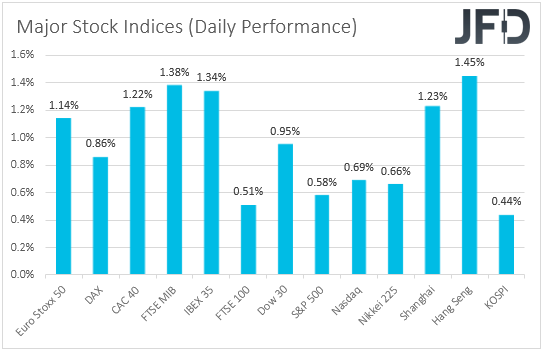
Following Wednesday’s slide, EU shares rebounded strongly on Thursday, confirming our view that with the ECB staying adamant that it is not time to start withdrawing monetary policy support yet, the latest setback could prove to be just a corrective phase. A dovish stance by the BoE may have also helped sentiment during the EU trading to improve. The Bank decided to keep its policy settings unchanged, with only one member voting in favor of QE tapering. That member was Chief Economist Andy Haldane, for whom this was the last meeting. The Bank repeated that the surge in inflation is expected to be transitory, and added that they do not want to undermine the recovery by premature tightening, disappointing those expecting signals that something like that could be announced at the next gathering. The outcome also affected the British pound, which was yesterday’s main loser. So, with the BoE decision in mind, and also taking into account concerns over the spreading of the Delta coronavirus variant in the UK, we cannot rule out further retreat in this currency, especially against the commodity-linked ones Aussie and Kiwi, which we expect to stay under some buying interest in case the broader market sentiment stays supported as well.
Later, in the US, investors appetite remained improved and that continued during the Asian session today as well, perhaps after US President Joe Biden embraced a bipartisan Senate infrastructure deal, which may help to extend the recovery in the world’s largest economy. Today though, investors are likely to turn their gaze to the core PCE index, which is the Fed’s favorite inflation metric, in order to form a better opinion on what the Fed’s future plans may be. This inflation index is expected to have risen to +3.4% yoy in May from +3.1%, further above the Committee’s objective of 2%, something that could raise more questions as to whether the latest surge in headline inflation is indeed due to transitory factors. Speculation over a potential rate hike as early as next year could increase again, something that may result in a new setback in equities and another rebound in the US dollar.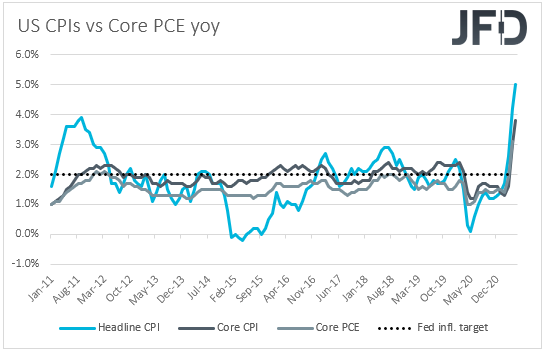
S&P 500 Technical Outlook
The S&P 500 cash index marched north yesterday, overcoming its prior record of 4267.10, hit on June 15, and entering uncharted territory. The move has confirmed a forthcoming higher high, which may have signaled the continuation of the prevailing uptrend. Thus, we would see decent chances for the bulls to stay in charge for a while more.
The break above 4267.10 may have opened the way towards the round figure of 4300, where investors may take a break, thereby allowing the index to correct slightly lower. However, if the retreat stays limited above or near the 4267.10 level, we would see chances for another leg north and a break above 4300. Something like that may see scope for extensions towards the next level we consider as psychological, which is at 4350. That said, an acceleration in the core PCE index today may result in an earlier setback.
Nonetheless, in order to start examining the case of a larger correction to the downside, we would like to see a clear dip below 4215. This could discourage investors to jump back into the action soon, something that may allow declines towards the 4167 territory, defined as a support by the low of June 3. Another break, below 4167, could aim for the low of this Monday, at around 4135.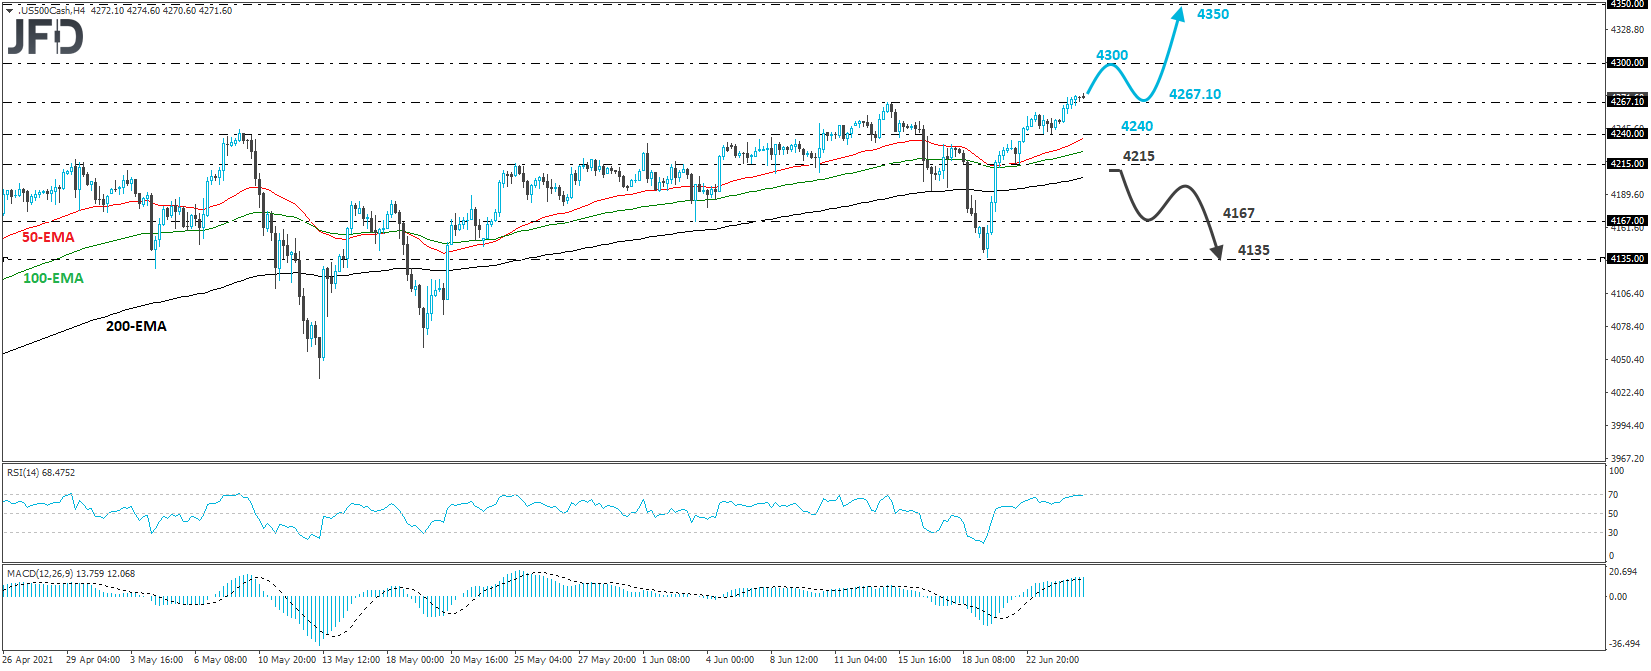
GBP/NZD Technical Outlook
GBP/NZD fell sharply on Thursday following the dovish language of the BoE, to hit support at 1.9665. Overall, the pair remains below the prior upside support line drawn from the low of May 27, as well as below the newly-established downside line taken from the high of June 22. In our view, these technical signals paint a negative short-term outlook.
At the time of writing, the rate is trading fractionally above the 200-EMA, which coincides with the 1.9665 barrier. If the bears are strong enough to overcome that support zone, we could see them aiming for the 1.9575 area, marked by the low of June 7, the break of which could extend the fall towards the 1.9470 zone, or the 1.9430 hurdle, defined as a support by the low of June 1.
In order to start examining whether the outlook has turned bullish, we would like to see a move back above 1.9960, the high of June 22. This could confirm the rate’s return above the aforementioned diagonal lines and may initially target the psychological zone of 2.0000. A break above that zone, could open the path towards the 2.0125 area, defined as a resistance by the high of Aug. 25, where another break could carry larger bullish implications, perhaps setting the stage for extensions towards the peak of Aug. 20, at around 2.0280.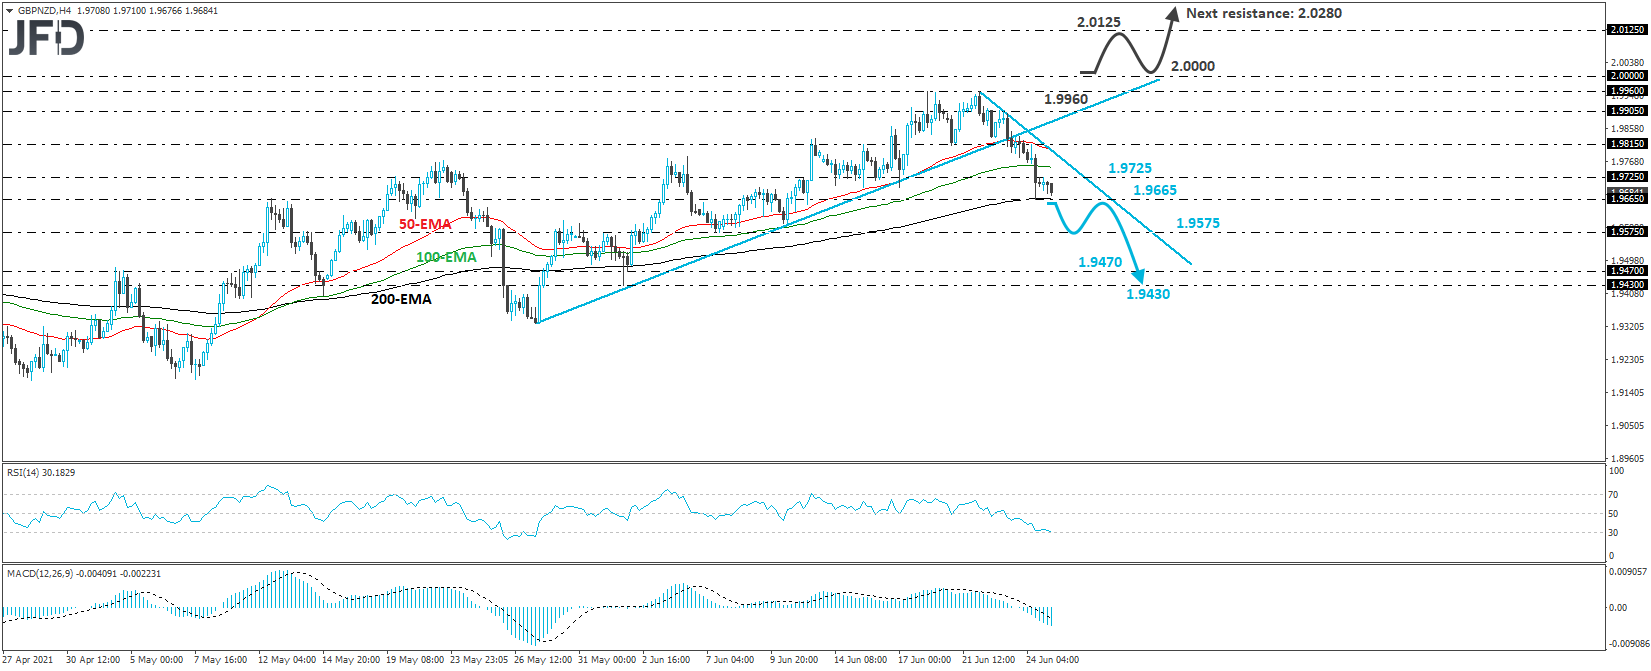
As For The Rest Of Today's Events
Alongside the core PCE index, we also get personal income and spending for May. Income is expected to have decreased 2.5% mom, after slumping 13.1% in April, while spending is anticipated to have slowed to +0.4% mom from +0.5%. The final UoM consumer sentiment index for June is also due to be released and it is expected to confirm its preliminary estimate of 86.4.