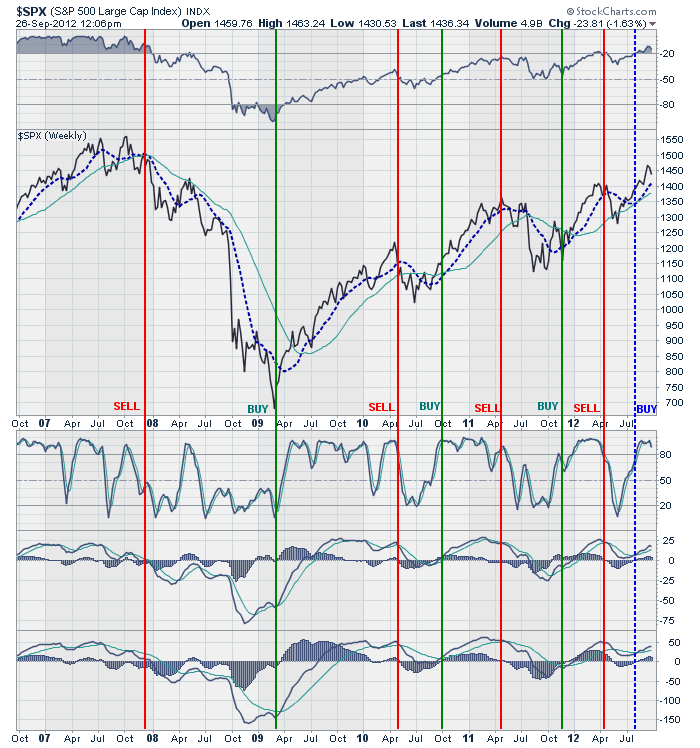
Over the past three weeks I have been reiterating that the markets were due for a correction. The run up in the markets from the May lows, in anticipation of the announcement of QE3 by the Fed in September, took the markets from oversold to extremely overbought conditions. However, as shown in the following chart, with all of our market "buy" signals in place we have moved from a defensive posture of selling rallies to buying dips. As a consequence of QE3, and as the markets move into the seasonally strong time of the year, it is likely that declines will be shallow.
The one thing to note is that the markets are reaching the same levels of long term overbought conditions that we last saw at the peak of the market in 2008. While the media continues with its daily diatribe of establishing price targets for the broad indexes that push the boundaries of logic - the reality is that the advance over the last three years is pushing the limits of historical price movements. Could this time be different? Sure...it just never has been in the past.
However, the reality is that the markets are currently being driven by Central Bank intervention and prices have become detached from fundamental and economic realities. This is a much different environment than we saw during the previous two QE programs. This is specifically why I have been discussing the risk / reward analysis of the markets to wit:
"As investors, like good gamblers, we need to have an estimation of what we can 'win' if everything goes right versus what we can 'lose' if something goes wrong."
Understanding the trade-off between what you can gain versus lose is critical to evaluating how much capital you expose to risk. Most investors have no concept of risk management but this analysis is crticial to long term investment success. Two weeks ago, as the markets were pushing new annual highs, I stated then that the maximum upside for the markets was likely the 2007-2008 market peak of 1560. The markets closed that Friday at 1465. Using that 1465 level I went through the risk/reward analysis as follows:
"The maximum return (or reward) would be: 1560 ÷ 1465 -1 = 6.48%
In order to calculate our risk/reward ratio we need to identify support areas to which the market could 'dip' to in the days ahead. These 'dips' will provide a better entry level for increasing risk based exposure. The addition of Fed stimulus will limit market declines unless some other exogenous event occurs.
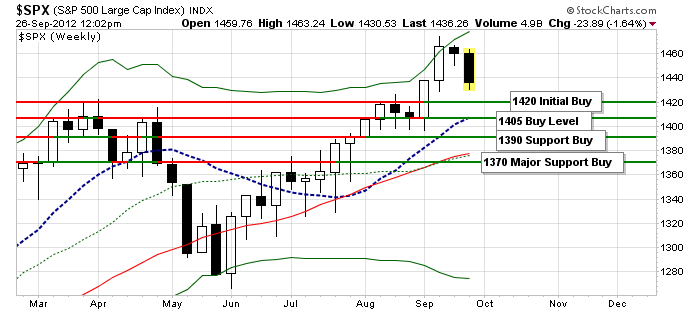
The chart below defines these current pullback levels. [Note: I have updated the chart to reflect current price levels] 
With the markets already more than 2-standard deviations overbought it is likely that we could see a pullback as soon as next week. Be a little patient and do not chase the market. It is dangerous at these levels.
Risk To Level 1) 1420 ÷ 1465 – 1 = -3.07%
Risk To Level 2) 1405 ÷ 1465 – 1 = -4.09%
Risk To Level 3) 1390 ÷ 1465 – 1 = -5.12%
Risk To Level 4) 1370 ÷ 1465 – 1 = -6.48%"
The current correction is now pushing low enough to begin testing these support levels providing an opportunity to add to current equity exposure with better potential return metrics as shown below (using the previous support targets from above.)
Reward From Level 1 To Target: 1560 ÷ 1420 – 1 = 9.85%
Reward From Level 2 To Target: 1560 ÷ 1405 – 1 = 11.03%
Reward From Level 3 To Target: 1560 ÷ 1390 – 1 = 12.23%
Reward From Level 4 To Target: 1560 ÷ 1370 – 1 = 13.87%
At the current time, as long as all things remain status quo, I am not expecting to see the lower levels of support tested. The current support level has now risen from 1420 to 1425, and it is important that this level hold in the coming days, otherwise we will begin to test lower levels.
Don't Dismiss The Risks
We have been warning about the potential dangers of a resurgence of the eurozone crisis, a sharper downturn in earnings and slower economic growth - all of which could throw a wrench in the currently bullish bias. In just the past few days alone have seen the embers of the eurocrisis once again being fanned as riots over austerity in Greece and Spain rise while Germany puts the brakes on the ESM and the potential ECB bond bailout program.
Domestically, Caterpillar (CAT), FedEx (FDX), UPS (UPS) and Norfolk Southern (NSC) have all warned about a weaker economy ahead as the recession in Europe, and slowdown in China, which I have warned about, has finally begun to impact the domestic economy.
The important point here is that "complacency" is currently the biggest risk in investment portfolios. The general consensus is that because the Fed has implemented QE3 that the markets cannot go down. While that has been true in the past - that history is extremely limited and the market metrics when QE was launched in 2009, versus 2012, are entirely juxtaposed. While I do expect that the current QE program may well limit downside risk at the moment - markets have a nasty habit of doing what you do not expect when you least expect it. This is no time be a passive investor.
Therefore, assuming that the current correction holds expected support levels, I have updated the guidelines for increasing equity exposure in portfolios. 
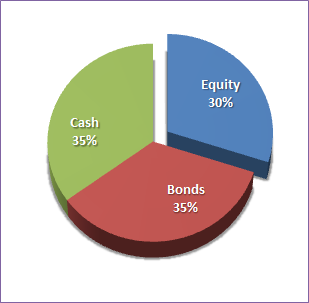
1) Rebalance bond portfolios to target levels to capture current gains. Assuming a 60/40 allocation model - bonds should be rebalanced to 35% of the total portfolio with cash making up the remaining 5%. If we begin to see the effects of the Fed's bond buying program it should push interest rates higher as money is pulled from bonds to chase equities.
2) Review current holdings
- Sell positions that are severely lagging the market.
- Trim winning positions back to target allocation weights.
- Review all other positions to make sure they contain no underlying risks that have been overlooked.
3) Identify new equity positionsto be added to portfolio during corrective market actions. Favored sectors for a QE 3 environment are:
- Energy
- Industrials
- Finance
- Technology
- Materials
4) On market pullbacks, as identified above, execute purchases of identified targets as follows:
- 1420 – buy 25% of position. If market turns back up add balance of position.
- 1405 – buy additional 25% of position. If market turns up add remaining balance of position.
- 1390 – buy additional 25% of position. If market turns up add remaining balance of position.
- 1370 – buy final 25% of position. If market turns up add remaining balance of position.
This is a scale in buying program designed to average into positions during a correction phase. Currently, the risk of the market reversal turning into a full blown rout is somewhat limited. However, there are enough risks prevalent that such a rout is not entirely out of realm of possibility. Therefore, while increasing equity exposure in anticipation a stronger seasonal period ahead, if the markets break critical support levels, and reverses the bullish trend, then defensive actions will be required to reduce overall portfolio risk. This is the risk that exists and investors must be aware and prepared for such an event.
The 10 Best Days / Worst Days
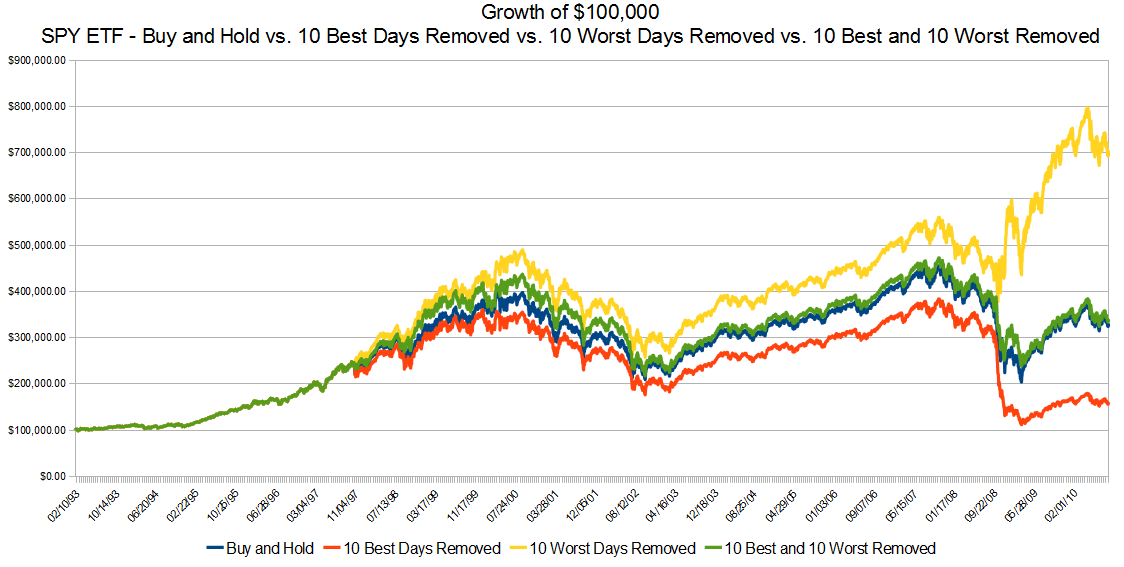
Understanding risk management is the key to the surviving the long term investment game. There are plenty of stories out there about what happens in you miss the 10 best trading days of the year. What you rarely see are stories about the increased returns you get by missing the 10 worst days. However, this is what it looks like: 
Being invested for the 10 best days accounts for 50% of the buy and hold performance (roughly 0.2% of the days from 1993 to August 2010.) However, the problem of chasing the "10 Best Days" is that you are most likely going to capture the bulk of the downside.
Here is an example. In a classic "Buy & Hold" portfolio, assuming a $100,000 investment into the S&P 500 Index, the net value at the end of the holding period is $324,330.15. If you happen to be out of the market during those "10 Best Days" of each year then the ending net value would fall by more than 50% to just $156,354.12. For the always bullish media, and mutual funds trying to sell you their wares, this is where the analysis stops. However, that isn't the whole story.
What is critically more important than trying to capture all of the "upside" of the market is avoiding the losses to investment capital during the declines. By simply managing to miss the "10 Worst Days" of each year an investor would see the portfolio more than double the "Buy & Hold performance by growing to $692,693.90.
The reality is that no one can consistently capture the 10 best days and miss the 10 worst. However, by applying risk management tools to a portfolio an investor, while likely missing some the best days, will avoid the bulk of the worst. It is the compounded effect over time of risk managed returns that will lead to long term investment success.
30 Years To Garner 10 Investment Guidelines
During the last 30 years of managing, investing, and watching capital work, as well as watching it evaporate more often than I care to remember, I have garned 10 guidelines that keep me out of trouble more often than not.
- Investing is not a competition. There are no prizes for winning but there are severe penalties for losing.
- Emotions have no place in investing. You are generally better off doing the opposite of what you "feel" you should be doing.
- The ONLY investments that you can "buy and hold" are those that provide an income stream with a return of principal function.
- Market valuations (except at extremes) are very poor market timing devices.
- Fundamentals and Economics drive long term investment decisions - "Greed and Fear" drive short term trading. Knowing what type of investor you are determines the basis of your strategy.
- "Market timing" is impossible - managing exposure to risk is both logical and possible.
- Investing is about discipline and patience. Lacking either one can be destructive to your investment goals.
- There is no value in daily media commentary - turn off the television and save yourself the mental capital.
- Investing is no different than gambling - both are "guesses" about future outcomes based on probabilities. The winner is the one who knows when to "fold" and when to go "all in".
- No investment strategy works all the time. The trick is knowing the difference between a bad investment strategy and one that is temporarily out of favor.
As an investment manager I am neither bullish nor bearish. I simply view the world through the lens of statistics and probabilities. My job is to manage the inherent risk to investment capital. If I protect the investment capital in the short term - the long term capital appreciation will take of itself. As Kenny Rogers once wrote: "Now Ev'ry gambler knows that the secret to survivin' - Is knowin' what to throw away and knowing what to keep."
