Live by the sword, die by the sword.” – Matthew 26, 26:52
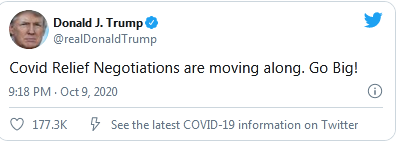
Such was the lesson quickly retaught to President Trump when we decided to halt stimulus talks on Tuesday, sending the market careening into the red. By Wednesday, Trump quickly reversed and has been talking up more stimulus all week.
The inherent problem of tying your Presidency to the stock market is that it’s all fine until it isn’t. The market crash in December of 2018, and again in March 2020, should have been a wakeup call. Unfortunately, it wasn’t, and now valuations, deviations for long-term means, and speculation have increased risk significantly.
Also, while more stimulus may be a great short-term “fix” for the economy, and ultimately the market when the Federal Reserve monetized the debt issuance, as discussed in this week’s #MacroView:
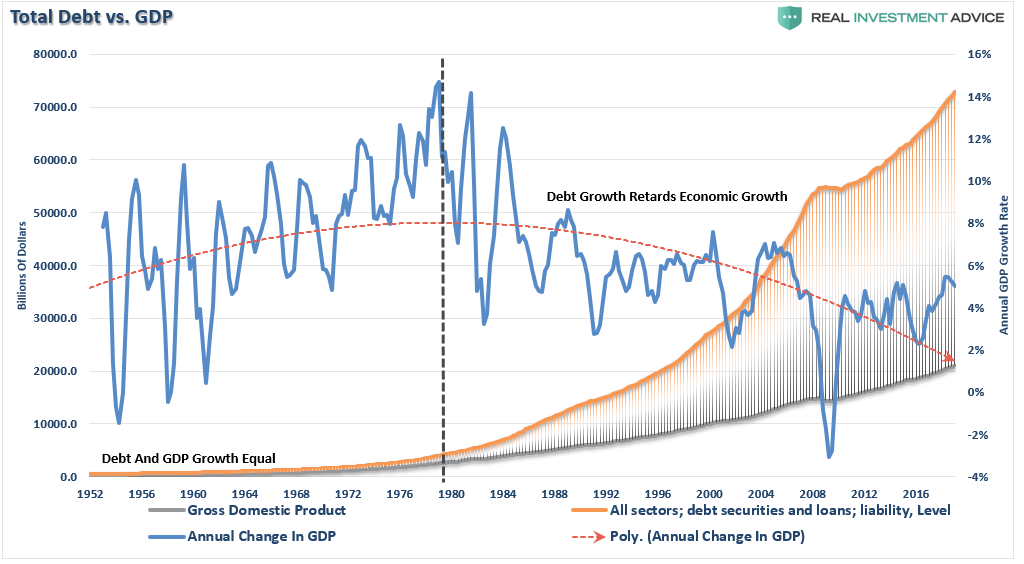
“More debt doesn’t lead to stronger rates of economic growth or prosperity. Since 1980, the overall increase in debt has surged to levels that currently usurp the entirety of economic growth. With economic growth rates now at the lowest levels on record, the change in debt continues to divert more tax dollars away from productive investments into the service of debt and social welfare.”
Nonetheless, the market rallied on what is for now “hope” of more stimulus. There is still no deal on Capitol Hill, and the parties are still far apart primarily on funding for states and municipalities.
Market Regains Its Footing
As I penned last week, we were expecting a rally this week.
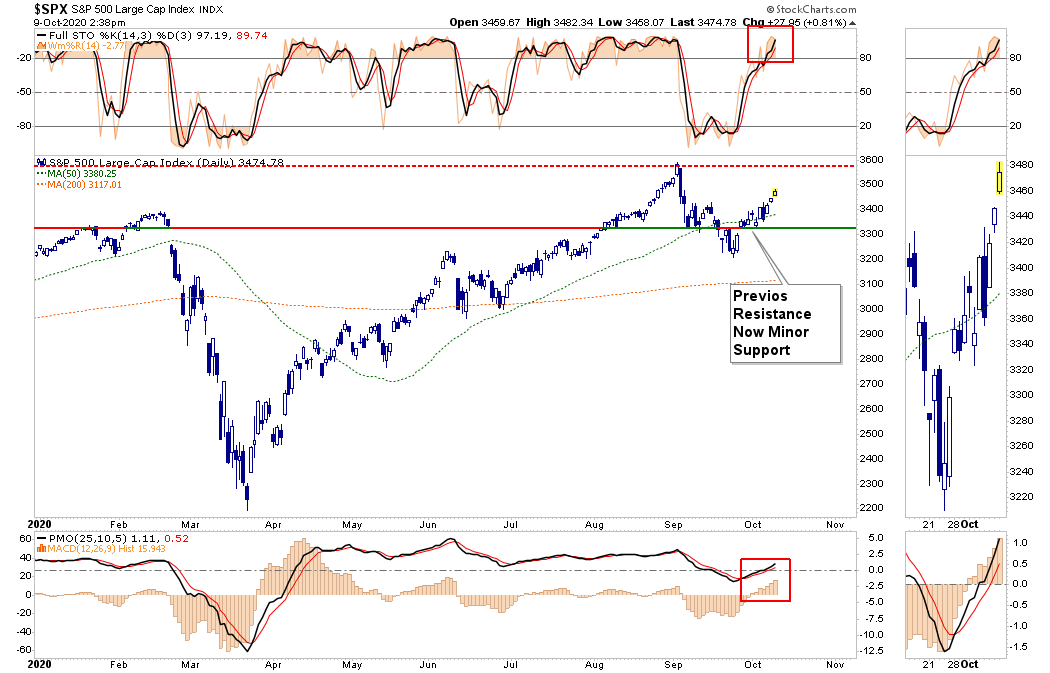
“Notably, while the rally that we have witnessed from the recent lows has eaten up a fair bit of the previous oversold condition, the MACD “buy signal” was triggered on Friday. Such suggests that we could see some additional buying next week.”
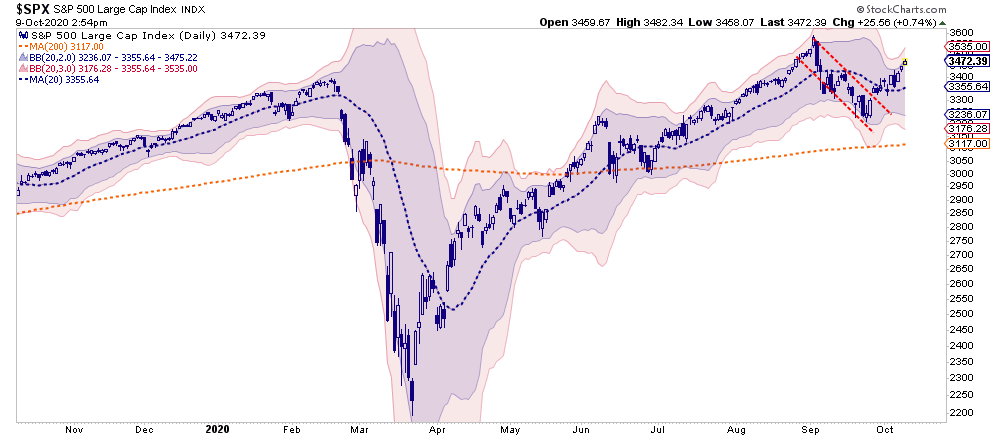
The market did indeed rally out of the gate on Monday but was cut short on Tuesday by Trump’s tweet shutting down stimulus talks. However, his quick retraction put the market back on more solid footing short-term.
Again, the Federal Reserve needs “more stimulus” to monetize the underlying debt issuance for investors. Such is how, ultimately, liquidity gets into the markets. With markets only about 3% away from all-time highs, there is really nothing to stop it from getting there unless stimulus talks break down once again.
Speculation Ramps Up
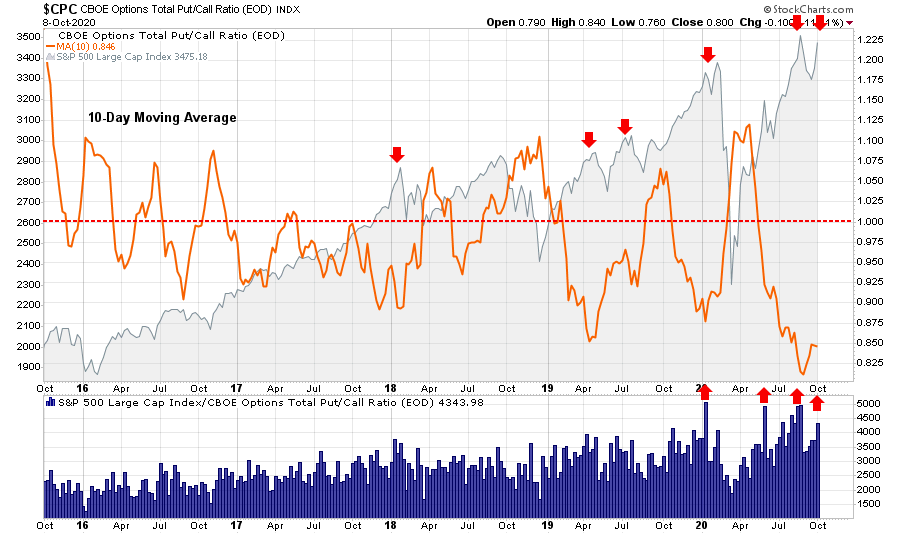
Retail investors have also ramped up speculative bets again, pushing the Put/Call ratio back towards previous highs. There is still room before getting back to previous levels, which suggests a run to all-time highs is possible.
However, while a retest of highs is certainly possible, the truncated rally so far has consumed much of the previous oversold condition. Such may limited upside returns in the short-term to some degree.
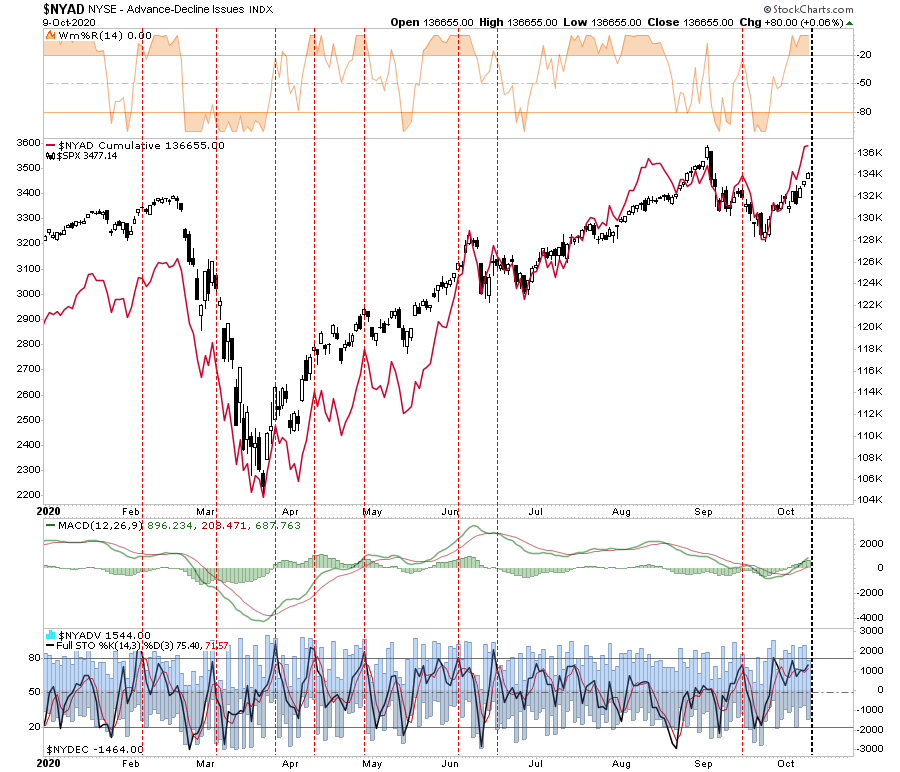
Furthermore, the cumulative Advance/Decline line is also at levels which has typically denoted short-term market peaks.
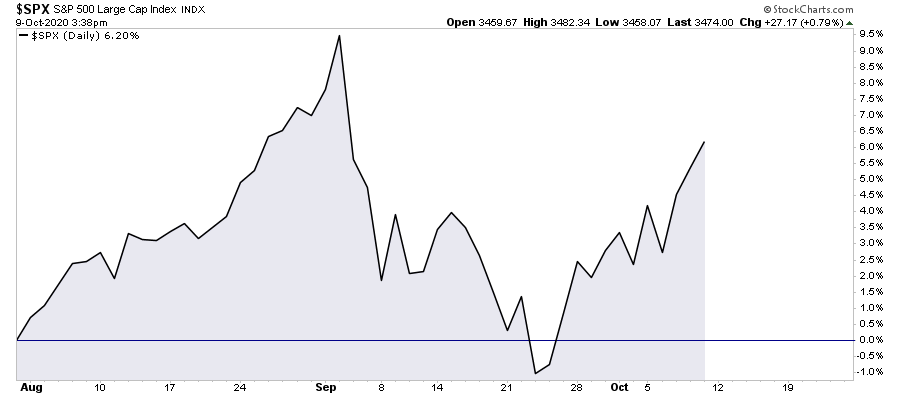
However, for now, the markets surge into the election has a history of picking the next President.
“The performance of the S&P 500 in the three months before an election has predicted 87% of elections since 1928 and 100% since 1984. When returns were positive, the incumbent party wins. If the index suffered losses in the three-month window, the incumbent loses.”
For now, the market is favoring the re-election of President Trump.
However, from an investment standpoint, we must focus on “policies” and not “politics.”
Presidential Return Recap
Over the last two weeks, we have discussed much of what happens to the stock market before post-Presidential elections. As a quick recap:
“Will policies matter? The short answer is, “Yes.” However, not in the short-term. Presidential platforms are primarily ‘advertising’ to get your vote. As such, a politician will promise many things that, in hindsight, rarely get accomplished.
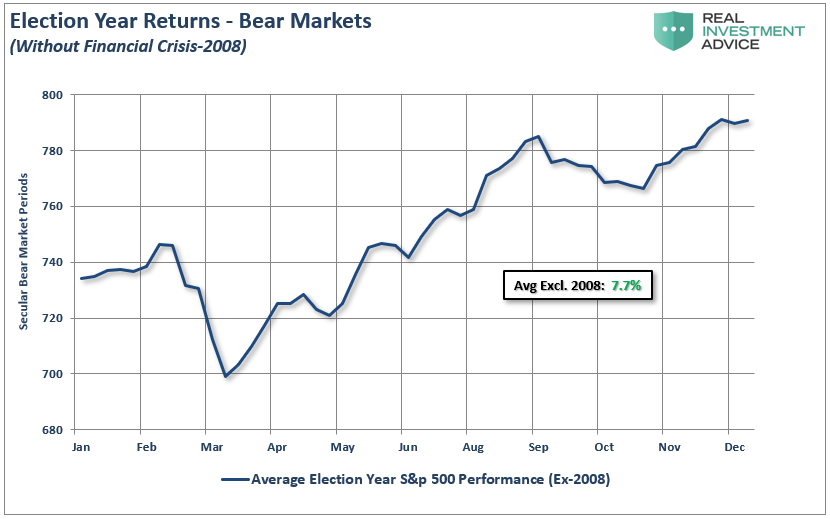
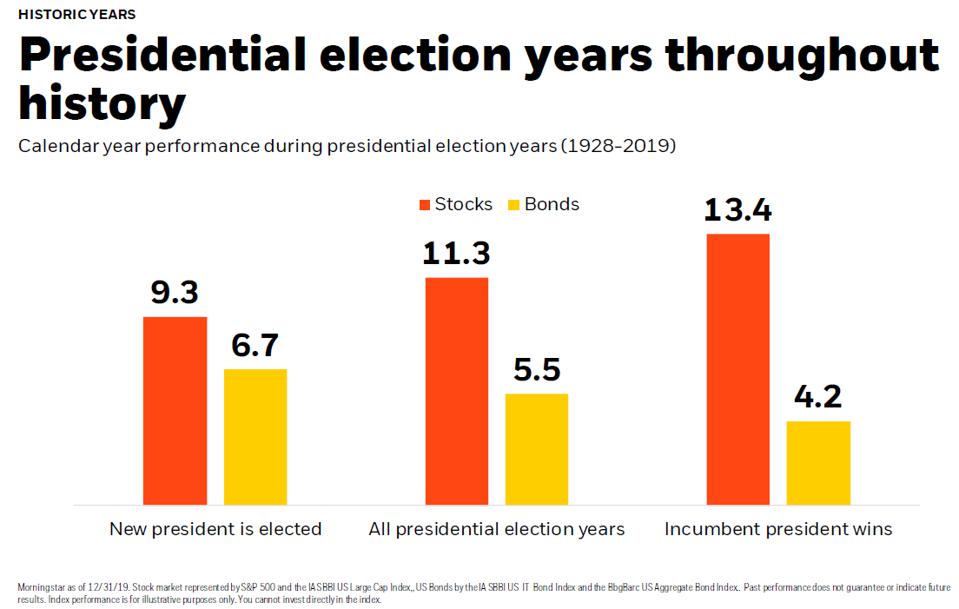
Therefore, while there currently much debate about whose policies will be better for the stock market, historically and statistically speaking, it doesn’t matter much. A look back at all election years since 1960 shows an average increase in the market of nearly 7.7% annually (exluding the 2008 ‘financial crisis.'” – Selloff Overdone
“However, it is worth noting that while returns are positive regardless of who is elected, it should be of no surprise the markets performed better during a year when voters re-elect the incumbent. The market hates uncertainty. In this case, Biden presents many unknowns: the potential for increased regulations, higher taxes, and other shifts the market perceives as anti-business.” – Is The Market Bounce Over?
Furthermore, this analysis only gets us through the end of the year.
What will matter as we head into 2021 will be the policies, not the politics.
Whoever Wins Loses
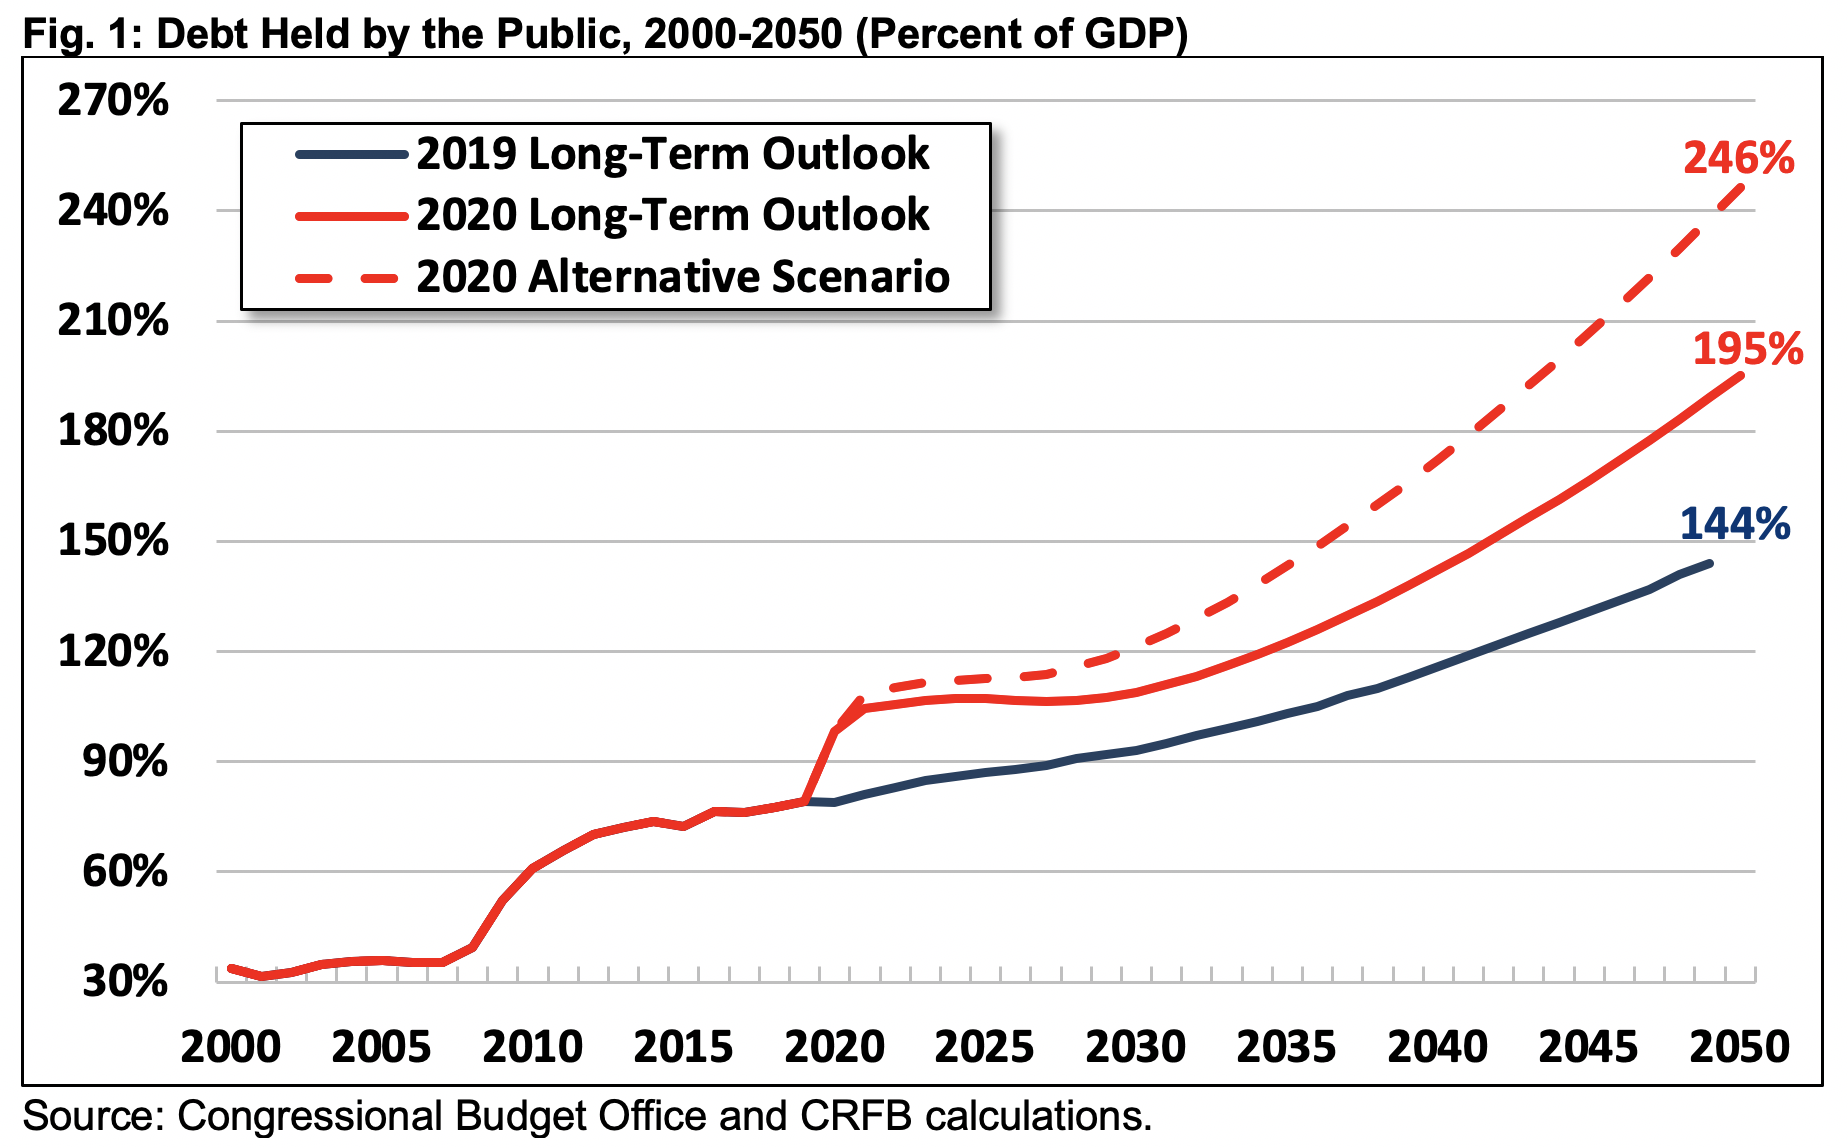
I don’t envy the person who takes the Oval Office in the months ahead. Whoever is inaugurated on January 20, 2021, will enormous fiscal challenges as trillion-dollar annual budget deficits will become the new normal. As we discussed recently, the national debt is projected to exceed the post-World War II record high over the next four-year term and reach twice the economy’s size within 30 years.
“Projected debt in 2050 is nearly five times higher than the 50-year average of 42 percent of GDP. It will be on track to double the previous record of 106 set just after World War II. In dollar terms, debt will rise from nearly $21 trillion today to $121 trillion by 2050.” – CFRB
Four major trust funds are also headed for insolvency, including the Highway and Medicare Hospital Insurance trust funds, within the next presidential term.
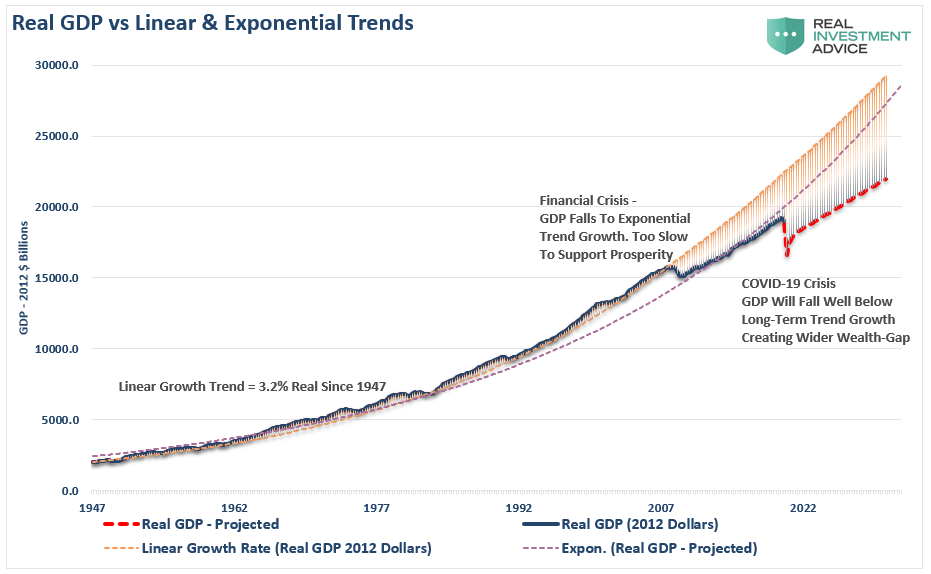
Furthermore, economic growth rates will decline as the “wealth gap” continues to widen.
“Before the “Financial Crisis,” the economy had a linear growth trend of real GDP of 3.2%. Following the 2008 recession, the growth rate dropped to the exponential growth trend of roughly 2.2%. Instead of reducing the debt problems, unproductive debt and leverage increased.”
Therefore, given there is no “will” to fix the problems before they break, whoever wins the Presidency will likely wind up losing.
Policies Over Politics
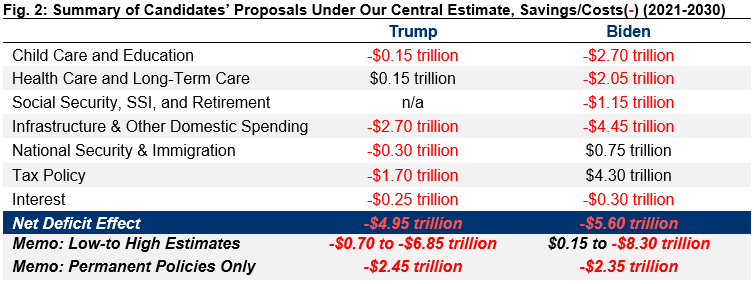
From an investment standpoint, the candidates’ policies will have an important bearing on economic growth and, ultimately, stock market returns. Our friends at the Committee For A Responsible Federal Budget (CFRB) did an excellent breakdown of candidates’ policies.
“President Donald Trump has issued a 54 bullet point agenda that calls for lowering taxes, strengthening the military, increasing infrastructure spending, expanding spending on veterans and space travel, lowering drug prices, expanding school and health care choice, ending wars abroad, and reducing spending on immigrants.
Vice President Joe Biden has proposed a detailed agenda to increase spending on child care and education, health care, retirement, disability benefits, infrastructure, research, and climate change, while lowering the costs of prescription drugs, ending wars abroad, and increasing taxes on high-income households and corporations.“
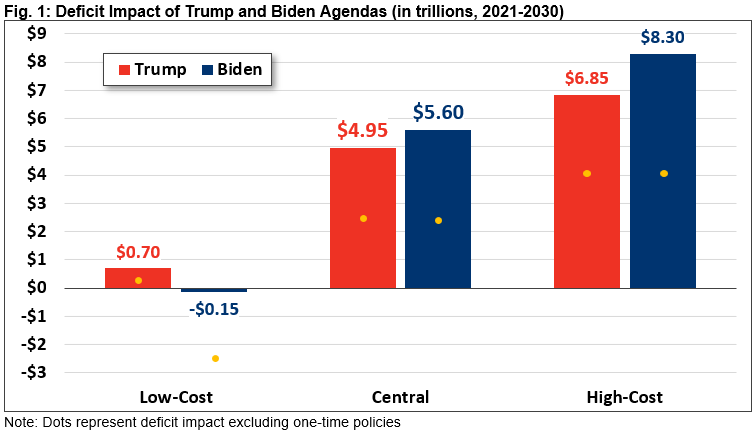
Importantly, neither of these plans will significantly improve economic prosperity, growth, or reduce the wealth gap. What both plans will do is significantly increase the debt and deficits.
The table below breaks down the spending by candidates in different areas of the economy.
Bridges To Nowhere
While markets tend to get excited over infrastructure projects, they are not the projects that create long-term revenue streams and are a productive use of debt. Over the last 30-years, most of the projects have been “roads and bridges to nowhere,” which has left America financially worse off as the debt service mounts.
Importantly, there is a simple equation for future stock market returns:
- Corporate Profits = Revenue (derived from economic growth) – Taxes
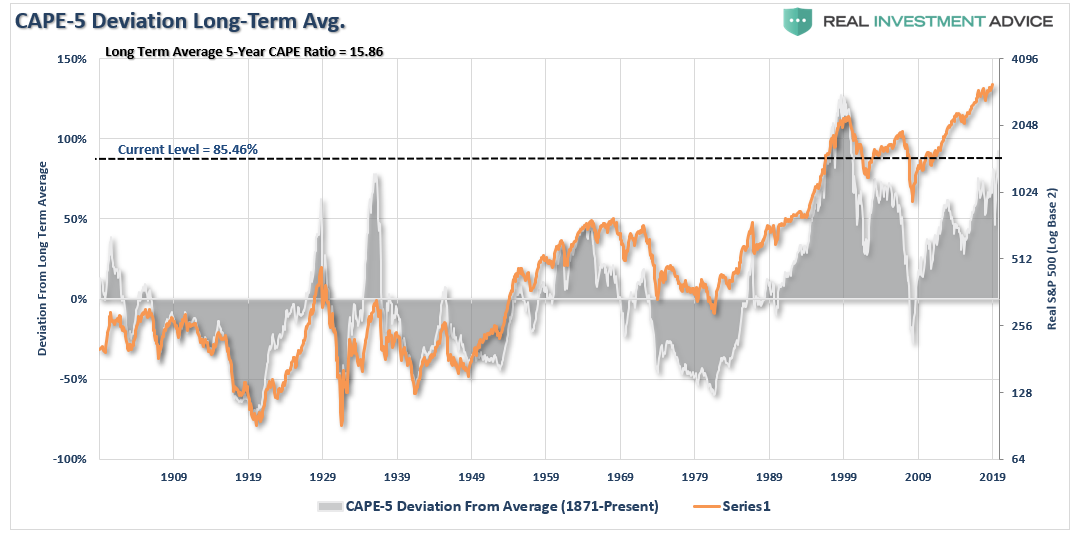
Due to the misguided use of debt and higher tax rates on corporations, slower economic growth rates will negatively impact earnings growth. Given multiples are already extremely expensive, policies that reduce future earnings growth will make valuations increasingly difficult to justify. (Chart shows the 5-year average P/E as a percentage deviation from the long-term average.)
- The stock market, and investors, will favor Trump’s policies over Biden’s.
- The masses begging for more handouts, and Government largesse will prefer Bidens.
Both leave us worse off.
“Under our central estimate, neither major candidate for President of the United States in 2020 has put forward a plan that would address our unsustainable fiscal path. Instead, both President Donald Trump and former Vice President Joe Biden have promoted policy agendas that would likely significantly add to annual deficits and increase debt-to-GDP over the next decade.” – CFRB
Both candidates have the wrong policy prescription for fixing what ails the economy. However, this is “the trap.” After 40-years of deficit spending, politicians continue to hope that more deficits will somehow create a surplus.
The math doesn’t work that way.
At some point, you have to stop digging.
- English (UK)
- English (India)
- English (Canada)
- English (Australia)
- English (South Africa)
- English (Philippines)
- English (Nigeria)
- Deutsch
- Español (España)
- Español (México)
- Français
- Italiano
- Nederlands
- Português (Portugal)
- Polski
- Português (Brasil)
- Русский
- Türkçe
- العربية
- Ελληνικά
- Svenska
- Suomi
- עברית
- 日本語
- 한국어
- 简体中文
- 繁體中文
- Bahasa Indonesia
- Bahasa Melayu
- ไทย
- Tiếng Việt
- हिंदी
Market Regains Footing On Hopes Of More Stimulus 10-09-20
Published 10/11/2020, 12:23 AM
Market Regains Footing On Hopes Of More Stimulus 10-09-20
3rd party Ad. Not an offer or recommendation by Investing.com. See disclosure here or
remove ads
.
Latest comments
Install Our App
Risk Disclosure: Trading in financial instruments and/or cryptocurrencies involves high risks including the risk of losing some, or all, of your investment amount, and may not be suitable for all investors. Prices of cryptocurrencies are extremely volatile and may be affected by external factors such as financial, regulatory or political events. Trading on margin increases the financial risks.
Before deciding to trade in financial instrument or cryptocurrencies you should be fully informed of the risks and costs associated with trading the financial markets, carefully consider your investment objectives, level of experience, and risk appetite, and seek professional advice where needed.
Fusion Media would like to remind you that the data contained in this website is not necessarily real-time nor accurate. The data and prices on the website are not necessarily provided by any market or exchange, but may be provided by market makers, and so prices may not be accurate and may differ from the actual price at any given market, meaning prices are indicative and not appropriate for trading purposes. Fusion Media and any provider of the data contained in this website will not accept liability for any loss or damage as a result of your trading, or your reliance on the information contained within this website.
It is prohibited to use, store, reproduce, display, modify, transmit or distribute the data contained in this website without the explicit prior written permission of Fusion Media and/or the data provider. All intellectual property rights are reserved by the providers and/or the exchange providing the data contained in this website.
Fusion Media may be compensated by the advertisers that appear on the website, based on your interaction with the advertisements or advertisers.
© 2007-2024 - Fusion Media Limited. All Rights Reserved.

