
EUR/USD
The EUR/USD remained well offered on every topside attempt. A failed attempt to clear resistance at 1.3756 (weekly pivot point, yesterday's S1, and 38% Fibonacci retracement) was frustrating for the bulls and has now given the sellers a reason to explore 1.3700 area. The Asian session showed a low volatility environment with trading contained in a 20 pip range. When zooming the price action to a finer granulation we can see declining tops and bottoms that ended up near the lower end of the range at the end of the session.
Inferring from price action alone, fresh buying interest could be found ahead of last week's low at 1.3650. There are signs that the EUR/USD is vulnerable through the oscillator readings. The RSI(14) is channeling lower at 38% currently accompanied by a MACD which is not showing a lot of momentum.
Resistance: 1.3747; 1.3756; 1.3775; 1.3808
Support: 1.3714; 13687; 1.3654; 1.3624 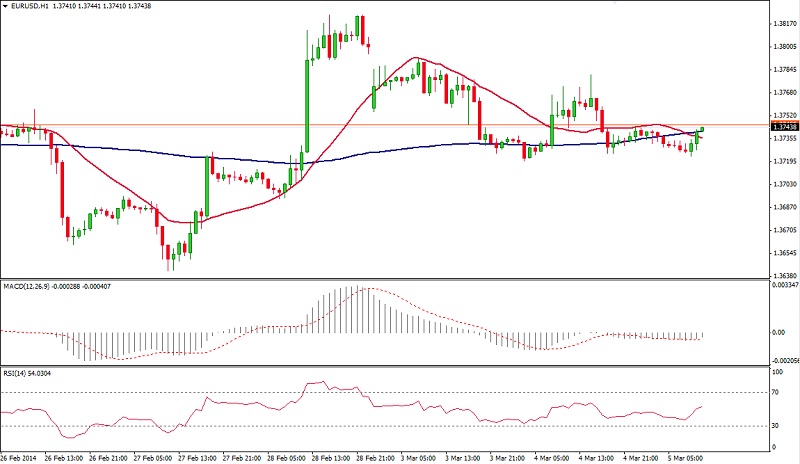 EUR/USD Hour Chart" title="EUR/USD Hour Chart" width="800" height="475">
EUR/JPY
There is still potential bullishness contained in the price structure since the cross managed to keep trading at the higher end of yesterday's rally. This is giving free exposure to longs entered at the swing low at the start of the week. But at the point when the chart is drawn, the benefit of the doubt is on the downside since the advance was slow and grudging. Decisive for today will be the weekly pivot at 140.11 playing its support role. Holding this level would open the scope for a further leg higher. Immediate level of support is the 200-SMA, presently at 140.24, which is likely to continue to underpin the rate for some periods.
Resistance: 140.88; 141.32; 142.14; 141.55
Support: 140.25; 140.11; 139.63; 138.81 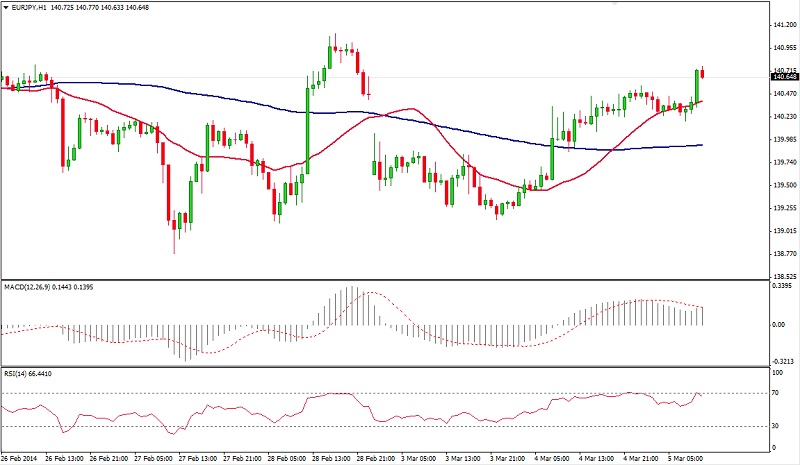 EUR/JPY Hour Chart" title="EUR/JPY Hour Chart" width="800" height="475">
GBP/USD
The GBP/USD continued to trade and hold below the 1.6700 level, a reason of concern to any bullish commitment in this major pair and didn't change yesterday's tone a great deal. The strong confluence of several technical barriers clustered at this level (the weekly pivot point at 1.6697, the 50% retracement from the swing low at 1.6640, and the round number “00”) proved to be a temporary barrier. For today we have the daily pivot at a similar level (1.6673) and Sterling is biding just below it at writing.
Negative near-term studies keep the downside in focus: the RSI (14) was unable to breach the 50% level during the low volatility Asian session, and the MACD just crossed above it's signal line but it's still printing in negative territory.
Resistance: 1.6700; 1.6750; 16782; 1.6823
Support: 1.6629; 1.6596; 1.6553; 1.6500 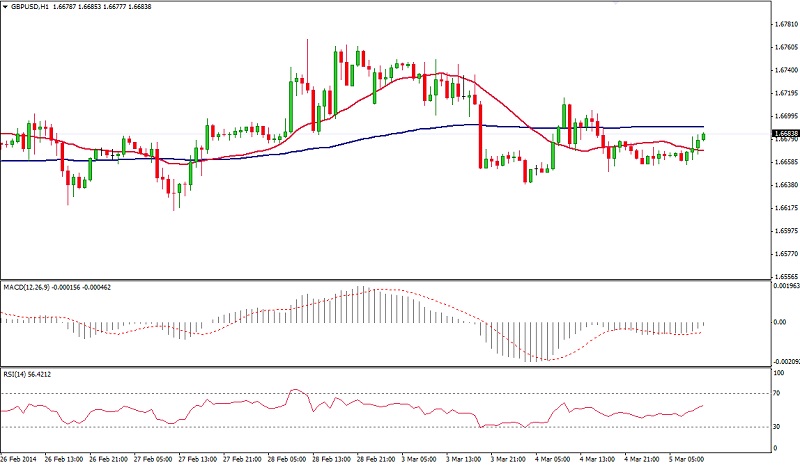 GBP/USD Hour Chart" title="GBP/USD Hour Chart" width="800" height="475">
USD/JPY
The cross still faces upside offensive threatening the 102.50/80 levels, the breaching of which could get it read of its downside vulnerability from higher time frames. Recent price action favors an extension higher with scope of projections at 102.50. With price hugging the 200 SMA on the hourlies (101.89), the average is functioning as mild support at writing (102.11) in a similar technical situation as with the EUR/JPY.
In order to eliminate the possibility of a further bout of strength, a push and hourly close under 102.00 is required (weekly pivot), targeting the former value area 101.50.
Oscillators on the 1-hour chart remain constructive but possible negative divergences may appear during the next two sessions which may delay the ascending process.
Resistance: 102.52; 102.84; 103.41; 104.50
Support: 102.00; 101.85; 101.73; 101.62 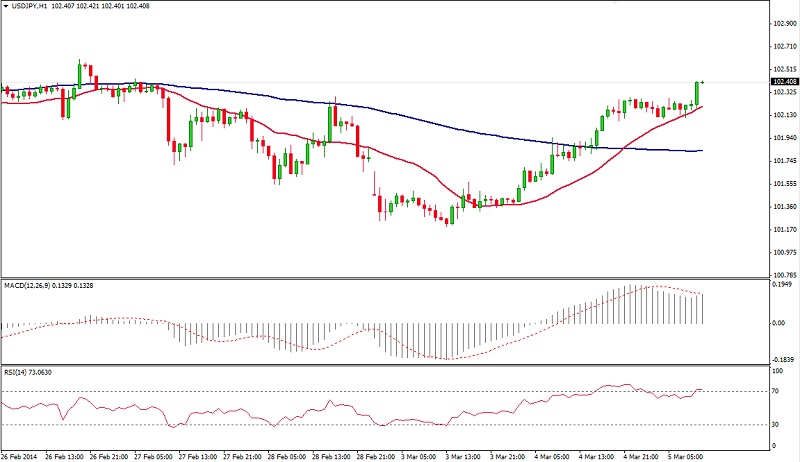 USD/JPY Hour Chart" title="USD/JPY Hour Chart" width="800" height="475">
AUD/USD
Erratic movements and growing price instability has been the tone for the Australian dollar in recent sessions. It peaked shy of the 0.9000 establishing a new weekly high but the whole price structure is still characterized by wild movements. The pair has returned to the same price range where the bulk of trading of the last three weeks has taken place, favoring range trading short-term strategies.
At time of writing the pair is quoting above its weekly pivot (0.8960) adding credence to the pair’s bullish profile of the last days despite the mentioned choppy and overlapping affairs in the price structure. Holding firm support at this level, we see risk through the new spike high 0.8995 up towards the round top formation on higher charts (around 0.9080), with overshoot threat to the falling 200-day SMA, now 0.9098.
Resistance: 0.9000; 0.9035; 0.9050; 0.9075
Support: 0.8942; 0.8916; 0.8883; 0.8856 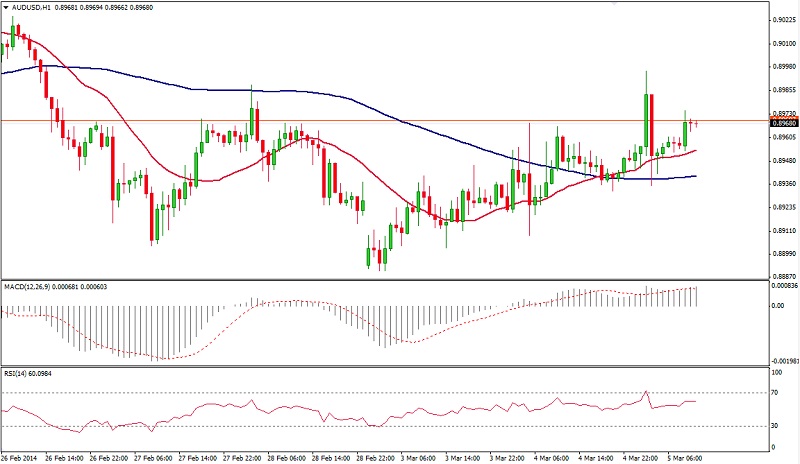 AUD/USD Hour Chart" title="AUD/USD Hour Chart" width="800" height="475">
AUD/NZD
The Pacific cross is still trapped in a trading range environment, quoting now at its lower edge (1.0663). The 1.0700 was well offered during the Asian session leaving the hourly chart with a second spike assault to the 38.2% of last week's plunge. This price action favors a resumption lower if we see a convincing break below 1.0650. The 1.0500 (24th January low) is coincidentally the 161.8% extension of the recent down leg.
An eventual back and fill type of action can't be ruled out this week since neat supply areas are left behind at 1.0750 and 1.0800 which expose us to eventual sharp pullbacks.
For the session ahead we continue to remain bearish while maintaining a degree of neutrality with regard to positioning. The oscillators on the hourly are hugging their center lines and of little use right now.
Resistance: 1.0706; 1.0741; 1.0767; 1.0800
Support: 1.0650; 1.0633; 1.0607; 1.0566 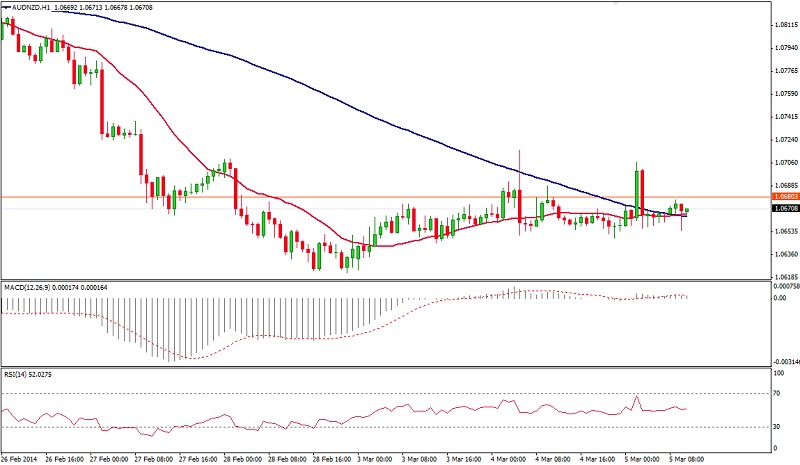 AUD/NZD Hour Chart" title="AUD/NZD Hour Chart" width="800" height="475">
XAU/USD
Judging by the triangular consolidation that has been developing on the hourly time frame, gold is likely to experience a trading range environment during this session. The apex of the triangle (1335) comes in in about 12 hours and is many times the definitive point from where a new sprint develops. 1330 is also where the weekly pivot is set, just above the still unfilled opening gap from Monday.
Under that scenario we subjectively favor downward continuation based on a cross of the moving averages which took place a few hour ago, and the fact that oscillators remain below their center lines.
On a higher time frame the metal is trading inside an ascending channel with support rising 20 points per day and now at 1394, coincident with the of the mentioned opening gap.
Resistance: 1345; 1350; 1355; 1361
Support: 1335; 1329; 1320; 1311 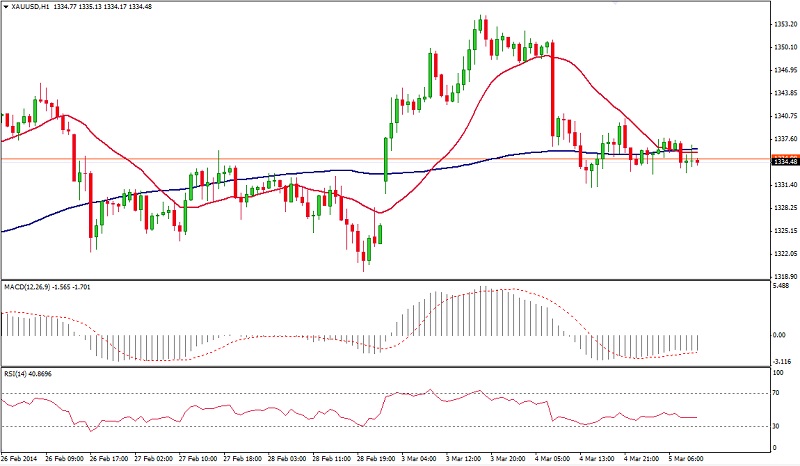 XAU/USD Hour Chart" title="XAU/USD Hour Chart" width="800" height="475">
- English (UK)
- English (India)
- English (Canada)
- English (Australia)
- English (South Africa)
- English (Philippines)
- English (Nigeria)
- Deutsch
- Español (España)
- Español (México)
- Français
- Italiano
- Nederlands
- Português (Portugal)
- Polski
- Português (Brasil)
- Русский
- Türkçe
- العربية
- Ελληνικά
- Svenska
- Suomi
- עברית
- 日本語
- 한국어
- 简体中文
- 繁體中文
- Bahasa Indonesia
- Bahasa Melayu
- ไทย
- Tiếng Việt
- हिंदी
Market Outlook: Potential Bullishness For The EUR/JPY
Published 03/05/2014, 04:58 AM
Updated 02/21/2017, 08:25 AM
Market Outlook: Potential Bullishness For The EUR/JPY
3rd party Ad. Not an offer or recommendation by Investing.com. See disclosure here or
remove ads
.
Latest comments
Install Our App
Risk Disclosure: Trading in financial instruments and/or cryptocurrencies involves high risks including the risk of losing some, or all, of your investment amount, and may not be suitable for all investors. Prices of cryptocurrencies are extremely volatile and may be affected by external factors such as financial, regulatory or political events. Trading on margin increases the financial risks.
Before deciding to trade in financial instrument or cryptocurrencies you should be fully informed of the risks and costs associated with trading the financial markets, carefully consider your investment objectives, level of experience, and risk appetite, and seek professional advice where needed.
Fusion Media would like to remind you that the data contained in this website is not necessarily real-time nor accurate. The data and prices on the website are not necessarily provided by any market or exchange, but may be provided by market makers, and so prices may not be accurate and may differ from the actual price at any given market, meaning prices are indicative and not appropriate for trading purposes. Fusion Media and any provider of the data contained in this website will not accept liability for any loss or damage as a result of your trading, or your reliance on the information contained within this website.
It is prohibited to use, store, reproduce, display, modify, transmit or distribute the data contained in this website without the explicit prior written permission of Fusion Media and/or the data provider. All intellectual property rights are reserved by the providers and/or the exchange providing the data contained in this website.
Fusion Media may be compensated by the advertisers that appear on the website, based on your interaction with the advertisements or advertisers.
© 2007-2024 - Fusion Media Limited. All Rights Reserved.