
EUR/USD
The euro remains in consolidative sideways mode around 1.37 handle, confirmed by yesterday’s Doji candle. The price action moves within 1.3690/1.3723 range, with neutral tone prevailing on hourly studies. On the other side, bullish 4-hour structure keeps the upside favored for fresh extension through pivotal 1.3738 peak, to resume larger uptrend off 1.3480 zone, towards targets at 1.3765, Fibonacci 100 expansion of the wave from 1.3561 and previous congestion tops at 1.38 zone in extension. The downside is for now protected by hourly 55SMA, with possible further easing required to hold above 1.3660, Fibonacci 38.2% retracement of 1.3561/1.3723 upleg / bull-trendline off 1.3482, to keep near-term bulls intact.
Resistance: 1.3723; 1.3738; 1.3765; 1.3800
Support: 1.3690; 1.3660; 1.3620; 1.3600 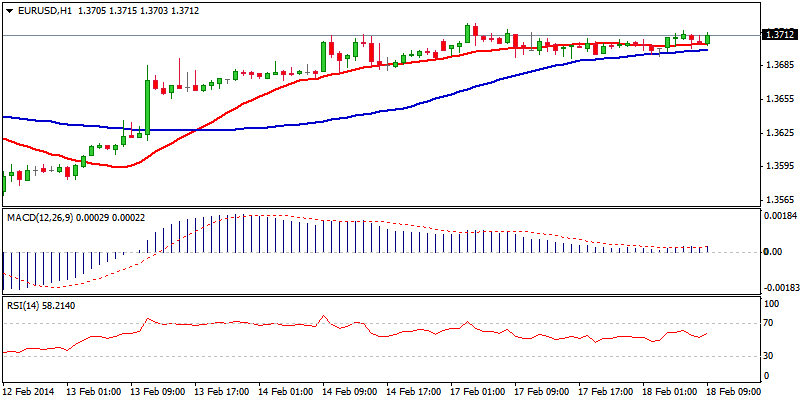 EUR/USD Hour Chart" title="EUR/USD Hour Chart" width="800" height="400">
EUR/JPY
The pair regained strength and the price surged through barriers at 140.00, trendline resistance and 140.29, 11 Feb previous peak, to complete bullish flag. Fresh extension higher aims towards initial targets at 141 zone, 50% retracement of 145.67/136.21 descend / daily 55SMA and 141.23, 29 Jan high. Positive near-term studies support further upside, with corrective action seen on overbought hourly conditions. Previous barriers at 140.29/00, offer immediate supports, with more significant 139 zone, higher platform / 38.2% retracement of entire 136.21/140.84 rally, expected to keep the downside protected.
Resistance: 140.84; 141.00; 141.23; 141.85
Support: 140.29; 140.00; 139.48; 139.00 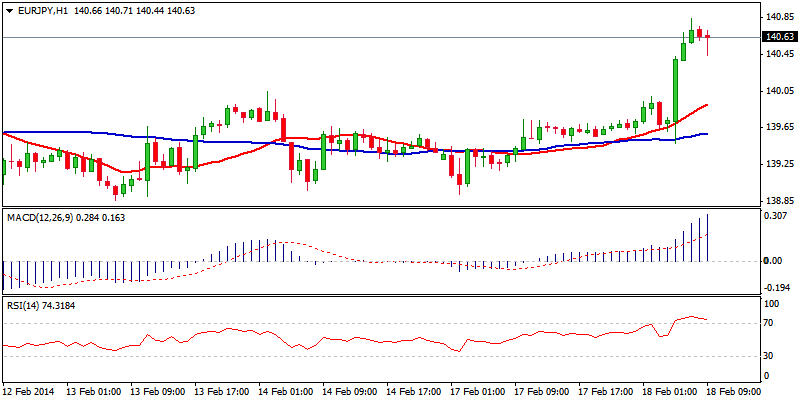 EUR/JPY Hour Chart" title="EUR/JPY Hour Chart" width="800" height="400">
GBP/USD
The pair enters corrective phase after fresh bulls cracked 1.68 barrier and peaked at 1.6821, levels last time visited in Nov 2009. Corrective easing probed 1.67 handle, with dips being so far contained by hourly 55SMA. Hourly indicators are reversing higher, while positive 4-hour studies maintain overall bullish tone. However, further easing through 1.6670, previous peaks and Fibonacci 38.2% of 1.6424/1.6821, would keep near-term bulls in play, while the price holds above 1.66 handle, 38.2% retracement of 1.6250/1.6821 rally. Extension above 1.6821 opens next targets at 1.6877, Nov 2009 peak and 1.6900, break of which to bring psychological 1.7000 resistance in focus.
Resistance: 1.6800; 1.6821; 1.6877; 1.6900
Support: 1.6694; 1.6670; 1.6620; 1.6600 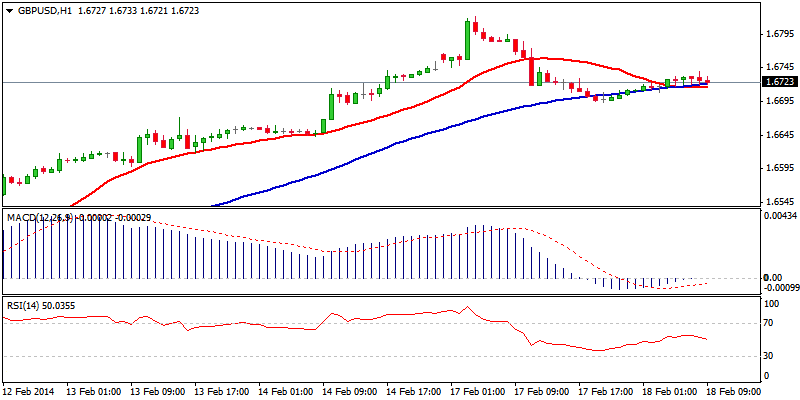 GBP/USD Hour Chart" title="GBP/USD Hour Chart" width="800" height="400">
USD/JPY
The price accelerated higher from 101.75 higher low and fully retraced 102.69/101.37 descend on extension to 102.73 so far. This sidelines downside risk and turns near-term focus higher, as 4-hour indicators are breaking into positive territory. Sustained break above 102.70 is required to confirm higher low at 101.75 and resume recovery off 100.74, towards 103.09, 50% retracement of 105.43/100.74 descend and lower top of 29 Jan at 103.43 in extension. However, overbought hourly conditions suggest corrective action should precede fresh rally, with 102.20, Fibonacci 38.2% of 101.37/102.73, seen as ideal reversal point to keep fresh bulls intact. Alternatively, extension below 102 handle, round figure support / 50% retracement, is expected to neutralize bulls.
Resistance: 102.69; 102.92; 103.09; 103.43
Support: 102.40; 102.20; 102.00; 101.75 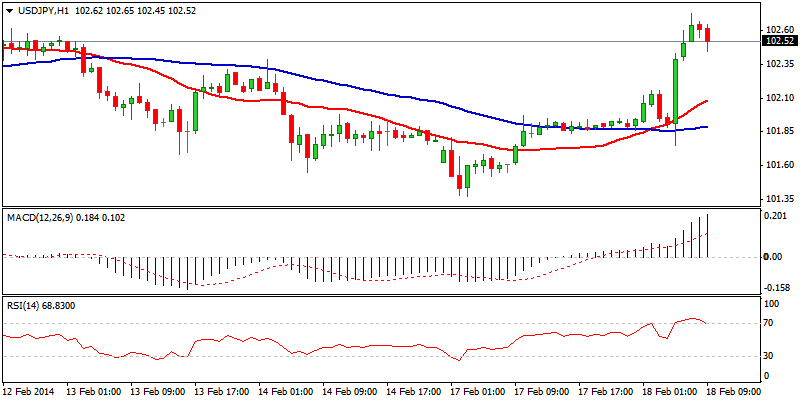 USD/JPY Hour Chart" title="USD/JPY Hour Chart" width="800" height="400">
AUD/USD
The pair consolidates recent gains off 0.8926 low that peaked at 0.9079. Consolidative range is established within 0.9015 and 0.9079, with near-term term price action being near the lower boundary, following repeated upside rejection that left marginally higher high at 0.9079. Further easing below 0.9000 handle and trendline support at 0.8990 would delay immediate bulls and keep the price within larger congestion of 0.8900/0.9079 and only break below 0.8900 zone, higher platform / Fibonacci 38.2% of 0.8658/0.9079 would neutralize. Near-term studies are losing traction and support such scenario. However, overall bullish tone sees fresh extension of recovery rally, once consolidative action is completed. Break above pivotal 0.9084 barrier to open 0.9146, 100SMA and 0.9165, 10 Dec 2013 high.
Resistance: 0.9079; 0.9084; 0.9146; 0.9165
Support: 0.9013; 0.9000; 0.8984; 0.8926 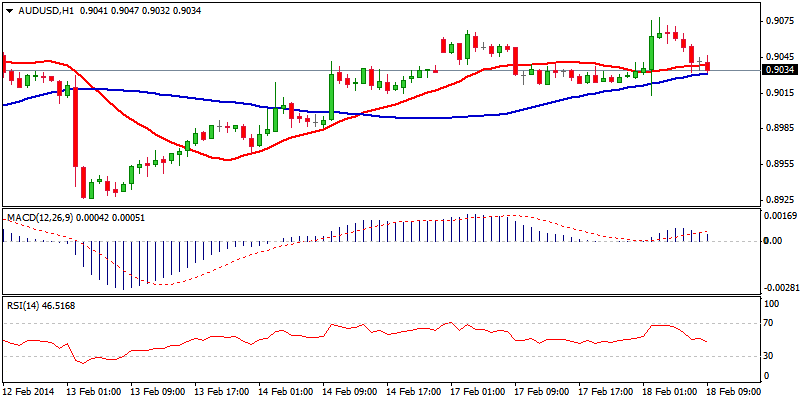 AUD/USD Hour Chart" title="AUD/USD Hour Chart" width="800" height="400">
AUD/NZD
The pair remains steady and extended near-term recovery phase off 1.0731 low to 1.0867, completing 1.0868/1.0731 bear-phase. Fresh bulls are establishing on 4-hour chart that supports further recovery, as the price left higher base at 1.0780 zone yesterday. Clear break above 1.0868 to open psychological 1.0900 resistance and key near-term barrier at 1.0942, 04 Feb high, clearance of which to signal resumption of larger correction from 1.0488, 24 Jan low, towards psychological 1.1000 barrier and 1.1044, 100SMA. On the downside, 1.0820/00, offers initial supports, with higher platform at 1.0780 zone, expected to protect the downside.
Resistance: 1.0867; 1.0900; 1.0942; 1.1000
Support: 1.0820; 1.0800; 1.0780; 1.0752 
XAU/USD
Spot Gold eases off fresh high at 1331, posted overnight, correcting strong rally off 1237 higher low. The price so far found footstep at 1314, hourly 55SMA, ahead of double-Fibonacci support at 1309 and psychological 1300 support, also 200SMA, where any stronger dips should be contained. Hourly studies are negative, while 4-hour indicators head south off overbought territory, leaving room for further easing. The notion is supported by overbought conditions on a daily chart. Extension below 1300 handle is expected to sideline bears and allow for deeper pullback towards the next significant levels at 1278/74, previous peak / Fibonacci 38.2% retracement of entire 1182/1331 upleg. Resumption of the uptrend is seen towards pivotal 1361, 28 Oct 2013 peak, regain of which to complete multi-month 1361/1182 bear-phase.
Resistance: 1321; 1331; 1351; 1361
Support: 1314; 1309; 1300; 1296 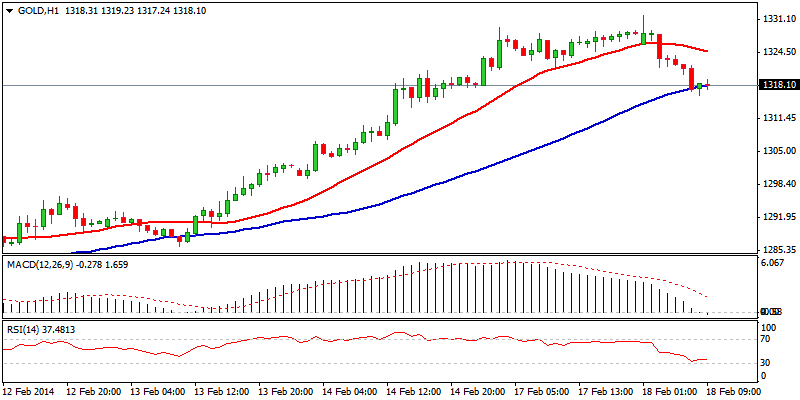 XAU/USD Hour Chart" title="XAU/USD Hour Chart" width="800" height="400">
- English (UK)
- English (India)
- English (Canada)
- English (Australia)
- English (South Africa)
- English (Philippines)
- English (Nigeria)
- Deutsch
- Español (España)
- Español (México)
- Français
- Italiano
- Nederlands
- Português (Portugal)
- Polski
- Português (Brasil)
- Русский
- Türkçe
- العربية
- Ελληνικά
- Svenska
- Suomi
- עברית
- 日本語
- 한국어
- 简体中文
- 繁體中文
- Bahasa Indonesia
- Bahasa Melayu
- ไทย
- Tiếng Việt
- हिंदी
Market Outlook: GBP/USD Enters Corrective Phase
Published 02/18/2014, 04:29 AM
Updated 02/21/2017, 08:25 AM
Market Outlook: GBP/USD Enters Corrective Phase
Latest comments
Loading next article…
Install Our App
Risk Disclosure: Trading in financial instruments and/or cryptocurrencies involves high risks including the risk of losing some, or all, of your investment amount, and may not be suitable for all investors. Prices of cryptocurrencies are extremely volatile and may be affected by external factors such as financial, regulatory or political events. Trading on margin increases the financial risks.
Before deciding to trade in financial instrument or cryptocurrencies you should be fully informed of the risks and costs associated with trading the financial markets, carefully consider your investment objectives, level of experience, and risk appetite, and seek professional advice where needed.
Fusion Media would like to remind you that the data contained in this website is not necessarily real-time nor accurate. The data and prices on the website are not necessarily provided by any market or exchange, but may be provided by market makers, and so prices may not be accurate and may differ from the actual price at any given market, meaning prices are indicative and not appropriate for trading purposes. Fusion Media and any provider of the data contained in this website will not accept liability for any loss or damage as a result of your trading, or your reliance on the information contained within this website.
It is prohibited to use, store, reproduce, display, modify, transmit or distribute the data contained in this website without the explicit prior written permission of Fusion Media and/or the data provider. All intellectual property rights are reserved by the providers and/or the exchange providing the data contained in this website.
Fusion Media may be compensated by the advertisers that appear on the website, based on your interaction with the advertisements or advertisers.
© 2007-2024 - Fusion Media Limited. All Rights Reserved.