
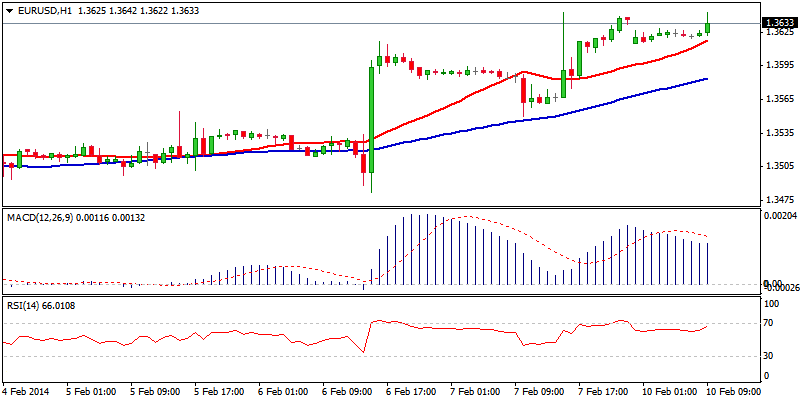
EUR/USD
The euro has established positive near-term tone on a bounce from 1.3480 zone, where the pair built a base. Extension above 1.36 barrier retraced over 61.8% of 1.3738/1.3475 downleg, on extension to 1.3642, keeping the upside in near-term focus. Fresh strength attempts to cover overnight minor gap, to extend the upleg from 1.3550 higher low, towards next hurdles at 1.3680/1.3700, 50% of 1.3892/1.3475 / 14 Jan peak, clearance of which to expose important resistance and breakpoint at 1.3735, Fibonacci 61.8% retracement / 24 Jan peak and daily cloud top. Near-term studies remain positive and support further bulls. Initial support lies at 1.3615, session low, ahead of 1.3600 support, daily Kijun-sen line, near daily cloud base and 1.3580, Fibonacci 38.2% of 1.3482/1.3642 rally, where corrective dips should be ideally contained. Only break below 1.3550 higher low would neutralize near-term bulls.
Resistance: 1.3642; 1.3635; 1.3680; 1.3700
Support: 1.3615; 1.3600; 1.3580; 1.3550
 EUR/USD Hour Chart" title="EUR/USD Hour Chart" width="800" height="400">
EUR/JPY
The pair trades in near-term corrective mode off fresh low at 136.21, with extension to 139.78 so far, retracing 38.2% of the downmove from 145.67 to 136.21. Rally was capped by bear-trendline from 145.67 peak / daily Kijun-sen line, with corrective action expected to precede fresh gains, as lower timeframes technicals are overbought. Corrective easing faces initial supports at 139.00/138.85, round figure / previous tops of 06/07 Feb, ahead of 138.42, Fibonacci 38.2% of entire 136.21/139.78 rally and 138.15 higher platform where stronger pullback should be contained. On the upside, break above psychological 140.00 barrier, reinforced by daily 20SMA, to open lower base at 140.40 zone and daily 55SMA at 140.85.
Resistance: 139.78; 140.00; 140.40; 140.85
Support: 139.00; 138.85; 138.42; 138.15 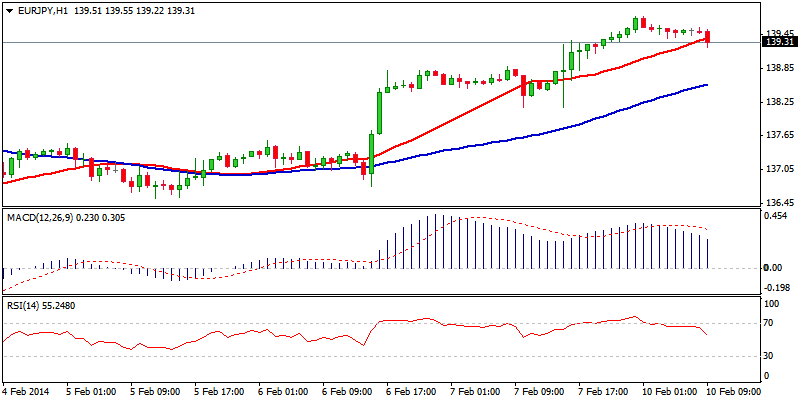 EUR/JPY Hour Chart" title="EUR/JPY Hour Chart" width="800" height="400">
GBP/USD
The Cable’s near-term structure improved, as the price broke above 1.6350 congestion top and probed above 1.64 barrier, where near-term consolidation is under way. Fresh bulls on 4-hour chart are supportive for further recovery towards Fibonacci resistances of 50% and 61.8% of 1.6623/1.6250 at 1.6437 and 1.6481. However, regain of 1.6500 barrier is required to shift focus towards the upper limits of near-term congestion. Otherwise, more downside risk could be anticipated in case of failure to sustain break above 1.64 handle. Overbought hourly studies warn of correction, with previous range tops at 1.6350, also near Fibonacci 38.2% retracement of 1.6250/1.6426 rally, seen as ideal reversal point.
Resistance: 1.6426; 1.6437; 1.6481; 1.6500
Support: 1.6390; 1.6359; 1.6338; 1.6300 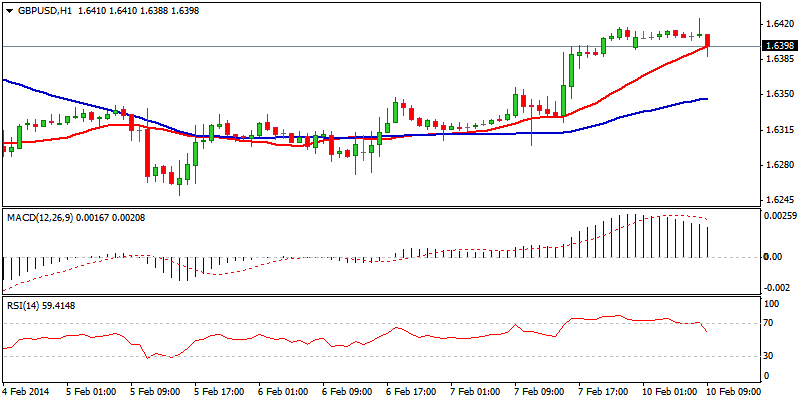 GBP/USD Hour Chart" title="GBP/USD Hour Chart" width="800" height="400">
USD/JPY
The pair remains in near-term corrective phase off 100.74, with fresh extension higher peaking at 102.63, above 38.2% retracement of 105.43/100.74 descend. Overnight gap-higher was expected to confirm bulls, however, pullback that filled the gap and pressures psychological 102 support, suggests more significant corrective action. Break below 102 handle, also near 38.2% of 100.79/102.63 rally, reinforced by hourly 55SMA, would be seen as a trigger for further easing towards 101.75, previous congestion top and 50% retracement and 101.50, 61.8%, below which bears are expected to take control. Resumption of the uptrend through 102.63 peak, opens lower top at 102.92 and 103.09, 50% retracement of 105.43/100.74 and key near-term barrier at 103.43, 29 Jan lower top in extension.
Resistance: 102.45; 102.63; 102.92; 103.09
Support: 101.90; 101.75; 101.50; 101.00 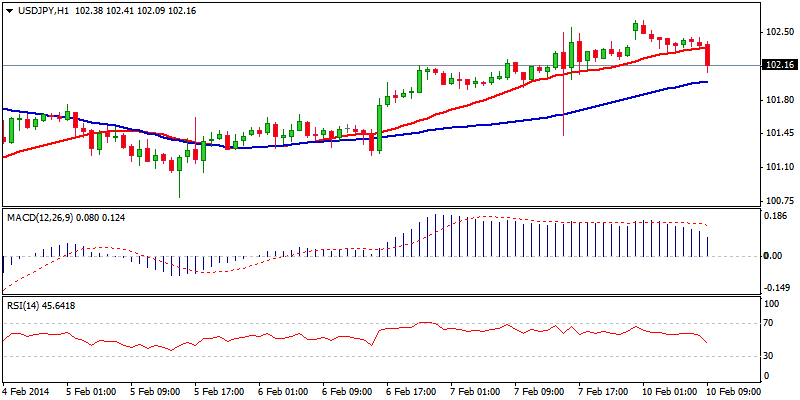 USD/JPY Hour Chart" title="USD/JPY Hour Chart" width="800" height="400">
AUD/USD
The pair consolidates recent gains that peaked ticks below psychological 0.9000 barrier, with near-term price action being so far contained at 0.8920. Hourly studies, however, are turning negative and 4-hour indicators losing traction that indicates corrective action in the near-term. Break below initial 0.8920/00 supports, is expected to open hourly higher base 0.8870, also Fibonacci 38.2% of 0.8658/0.8998 ascend and reinforced by 4-hour 55SMA, where the pullback should find a footstep and keep near-term bulls in play. On the upside, lift above 0.9000 barrier is required to open key resistance at 0.9084, 13 Jan peak, while alternative scenario sees loss of 0.8870 handle as a trigger for further easing that would sideline near-term bulls.
Resistance: 0.8998; 0.9056; 0.9084; 0.9100
Support: 0.8920; 0.8900; 0.8870; 0.8820 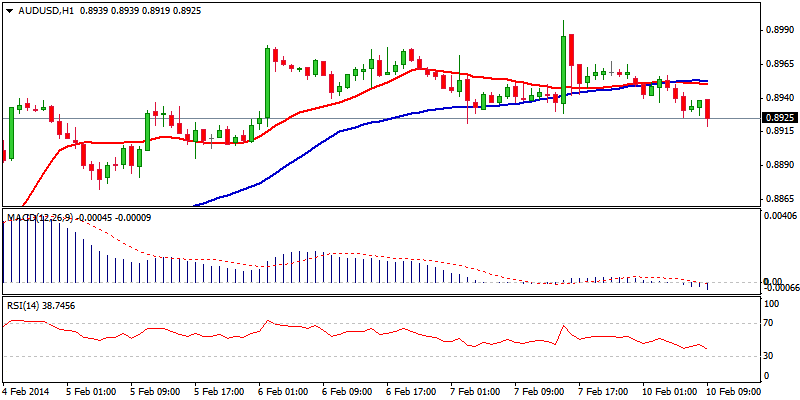 AUD/USD Hour Chart" title="AUD/USD Hour Chart" width="800" height="400">
AUD/NZD
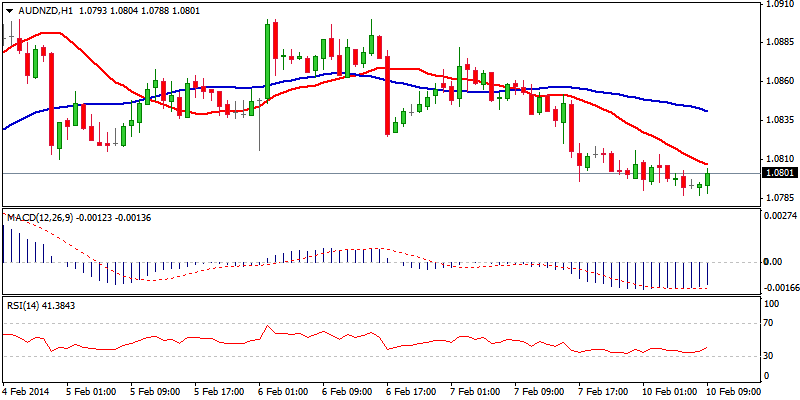
Near-term price action is at the back foot, as the price lost initial support and consolidation floor at 1.0810. Fresh bears, established on lower timeframes technicals, see risk of further easing, as the third wave that commenced from 1.0900 lower top, met its Fibonacci 76.4% expansion at 1.0790, with extension lower seen towards 1.0756, 100% expansion and 1.0700, psychological support, Fibonacci 138.2% expansion. Dips should be contained here, to keep bullish action off 1.0488 in play, with initial barriers at 1.0800/10 and more significant pivots at 1.0882 and 1.0900.
Resistance: 1.0810; 1.0825; 1.0882; 1.0900
Support: 1.0790; 1.0756; 1.0715; 1.0700
 AUD/NZD Hour Chart" title="AUD/NZD Hour Chart" width="800" height="400">
XAU/USD
Spot Gold’s near-term structure turns positive, as the price eventually broke above congestion and formed bullish flag. Positive tone dominates on near-term technicals and sees scope for final push through 1278, 27 Jan peak, to confirm completion of corrective phase and resume larger bulls off 1182, 31 Dec low. Sustained break to open next target at 1294, 14 Nov 2013 high, with psychological 1300 barrier seen in extension. Immediate support lies at 1266, also near 38.2% of 1247/1275 upleg, ahead of 1261 mid-point, where corrective dips should be ideally contained.
Resistance: 1275; 1278; 1285; 1294
Support: 1266; 1261; 1256; 1252 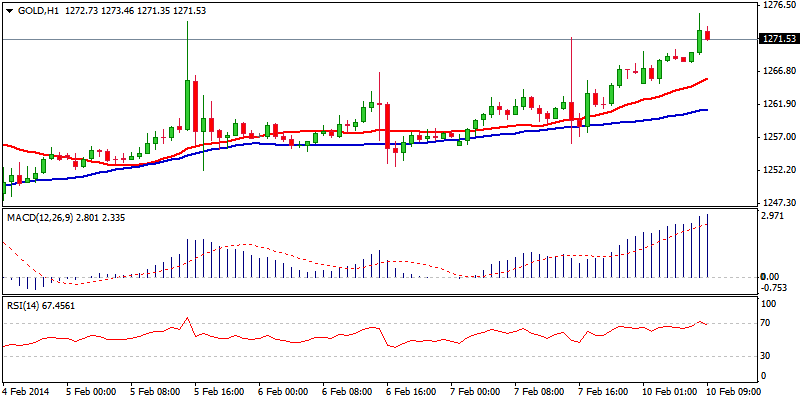 XAU/USD Hour Chart" title="XAU/USD Hour Chart" width="800" height="400">